
By Richard A. Werner
Table of Contents
II. Introduction: The Purposes of the Memo
- The importance of small businesses
- The importance of community banks for small businesses
- Negative developments in the U.S. and Tennessee community banking sector: The trend toward concentration and loss of benefits of local banks
IV. What Is a Sovereign State Bank with a Bullion Depository?
- To local banks, savings banks, and credit unions
- To local economy and TN GDP
- State and local government
- State pension funds
- Citizens
VI. Risk Management
- State requirement to take cash
- Protection against CBDCs
- Protection of financial transaction freedom and privacy
- Comments on related digital systems: Banking and telecommunication systems and state-controlled cloud
- The Bank of North Dakota
- History of State Banks in the U.S.
- Other historical examples
- Domestic, including recent legislation
- International
VIII. The Case for Growth and Prosperity
- The economy can only grow if banks lend for activities that contribute to GDP
- Asset bubbles can be prevented
- Only lending to the real economy is sustainable
- Lending for consumption can create inflation; lending for investment delivers growth without inflation
IX. Setting Up the State Bank of Tennessee
X. Conclusion
I. Executive Summary
This document presents to state legislators in Tennessee the case for setting up a State Bank of Tennessee (SBT). SBT would act as a second-tier bank, interposed between the Federal Reserve Bank of Atlanta (FRBA) and the Tennessee State Government (TSG) on the one hand, and local banks (community banks, credit unions, savings banks, locally-headquartered commercial banks) operating in Tennessee on the other. The goal of SBT is to ensure that the State of Tennessee can better act in the interests of its citizens, better fulfill its constitutional duties, and provide for a resilient and strong economy and financial system. SBT will not compete with smaller local banks for loan and deposit market shares, but will act to support them in a number of ways, including loan participations and purchases, while mutually benefiting from expanded liquidity in state-level short-term money markets.
Small and medium-sized enterprises account for the vast majority of jobs in Tennessee (as elsewhere) and research has demonstrated that their prosperity and capacity for job creation, innovation, and expansion depends to a significant extent on the availability and capacity of small local banks. Small firms and small banks depend on each other in a symbiotic relationship.
The establishment of SBT would help support small and medium-sized enterprises in Tennessee to gain access to funding and deposit markets, significantly strengthening the economy of Tennessee and also increasing tax revenues without any tax increases.
Key points:
- Minimal Cost: Setting up SBT would cost less than 1% of the State of Tennessee’s annual expenditures.
- Productive Lending: SBT would expand the amount of funding available to Tennessee’s 99 community banks (defined as those with total deposits <$1 billion and with >50% of their deposits booked in Tennessee) by 20% over the course of its first 10 years of operation. Since small bank lending tends to be allocated for productive purposes (business investment), the additional lending will be non-inflationary, and it will increase GDP and tax revenues.
- Community bank support: SBT will not compete for deposit or loan market shares with community banks; rather, it will support them with funding in the form of loan purchases and loan participations for larger volume lending operations.
- Resilience: SBT offers state-level secure depositary services for the State of Tennessee and the citizens and legal persons operating therein. This is an important pillar of a more resilient financial and economic system that is able to act in an agile manner and withstand unforeseen shocks and undesirable events outside the State of Tennessee. By including bullion depositary services, another pillar of financial stability and resilience can be added on the state level, ensuring overall a more resilient U.S. economy.
- State Government: SBT will be able to provide funding to the TSG on a regular basis.
- Bank Concentration: The number of community banks in Tennessee has fallen by 65% since 1990. The Tennessee banking system is relatively concentrated: 10 banks account for 64.2% of the deposit market (slightly above U.S. average of 60%).
- Catalyst: Banking system concentration is bad for small firms, which depend on bank funding and particularly on bank loans from small banks (“community banks”). The present trend toward fewer local banks in Tennessee has significant negative implications for small firms, dampening productivity growth and thus the overall economic outlook in Tennessee. However, the creation of the SBT can act as a catalyst to halt the trend toward concentration and is an important step to reverse it.
- Positive Example: SBT will follow the example of the Bank of North Dakota, the only existing U.S. state-owned bank that supports community banks.
- State Sovereignty: Establishing a state bank in Tennessee is also the best first step to counter the threats to state-level sovereignty, to economic prosperity, and to the human rights of Tennessee citizens posed by the recent move by the Federal Reserve system of exploring the introduction of a USD central bank digital currency (CBDC). Such a new central planning tool with unprecedented powers and reach would, among other threats, have a significant adverse effect on the capacity of banks in Tennessee to fund themselves with deposits from the local communities and trigger deposit outflows into the central bank to CBDC accounts. If the bank regulator decides to compete against its regulated banks, state legislatures have to step in to ensure fair competition and a fair and open marketplace that redresses the balance of market power. The creation of the SBT would be an important step in the direction of being prepared for such developments.
- Profitability: Banking is one of the most consistently profitable sectors in the economy. Return on equity in banking ranges usually between 12% and 30%, often averaging around 20%. It is foreseen that the SBT, apart from the many other benefits, will be a profitable operation that contributes attractive and steady returns to its owner.
- Timing: Rising interest rates provide an ideal environment for setting up new banks, as profit margins in banking are in a growth phase.
II. Introduction: The Purposes of the Memo
In recent years, a movement has spread across United States legislatures for state legislatures creating the legal basis for the establishment of state-owned banks. In 2019, the California Public Banking Act was passed. The act means cities and counties inside California will be allowed to create their own public banks. The law allows the state to license no more than two public banks per calendar year and caps the total number at ten (Koran, 2019). Counties including Los Angeles, San Francisco, and the East Bay are getting closer to establishing a state-owned bank, likely in the near future.
In 2021, the “New York Public Banking Act” was introduced into the state senate, creating the legal pathway for the establishment of public banks in the state of New York. Currently, New York City and the City of Rochester are working toward establishing state-owned public banks.
Also in 2021, Massachusetts, the second state in U.S. history after New York to have a public bank (in 1784), passed a bill in the state senate to create a public bank.
In Philadelphia, as recently as March 2022, the city council voted 15-1 in favor of establishing the “Philadelphia Public Financial Authority,” which is the first step in order to create a public bank for the state.
This memorandum contains the proposal for the establishment of a State Bank of Tennessee (SBT), a second-tier state-owned bank designed to act as depositary for the Tennessee State Government (TSG) and local banks in the State of Tennessee, as well as provide funding in the form of loans, loan participations, bond purchases, and other banking services.
The State Bank of Tennessee is modeled after the example of the Bank of North Dakota (BND), a conservative yet highly successful bank owned by the state of North Dakota that has helped community banks provide funding to small and medium-sized enterprises (SMEs) for many decades. Although it has played various roles since its founding in 1919, BND’s most important role has been to serve as a lending partner for North Dakota’s numerous small banks (loan participations and loan purchases from community banks in North Dakota account for the majority of its activities; student loans are another significant lending item in North Dakota) (Kodrzycki and Elmatad, 2011).
The rest of this memorandum makes the economic case for the State Bank of Tennessee. We start in the following section by describing the importance of small, local, and community banks for the economy, particularly for the financial health of small non-financial firms.
III. The Present State of Banking and the Role of Small and Medium-sized Enterprises in the U.S. Economy and in Tennessee
a) The importance of small businesses
Today’s globalized economies may seem to be dominated by large corporations, as they have large budgets for political lobbying. As a result, the crucial macroeconomic and societal role of small firms tends to get neglected. The data demonstrate their importance: In the U.S., small businesses account for 99.9% of all businesses by number, about half of all employment (Main, 2022), 64% of the new net jobs created every year, and 44% of GDP (Zhou, 2023). Expanding the definition to small and medium-sized businesses, we find that they account for more than half of all employment in the U.S. Similar results are found in other countries. In most OECD countries, SMEs account for 30% to 70% of value added, 15% to 50% of exports, 60% to 70% of employment, and for a disproportionately large share of new jobs (OECD, 1997, p. 8).
Perhaps most strikingly, SMEs are the biggest net job creators. According to the International Labour Office (2015, p. 9), young enterprises, especially young SMEs, “create a disproportionately high number of jobs.” The report is referring to the fact that they create more jobs than are expected by looking at their share of employment. And not only do they create more jobs, they also destroy fewer jobs, being strong net job creators. The report adds that,
“Although young enterprises respond more strongly to economic upturns or downturns than old enterprises, they remained net job creators during the Great Recession of 2007–09. Most of the job losses were caused by contractions of mature businesses” (Ibid., p. 9).
The following figure is taken from that same report.
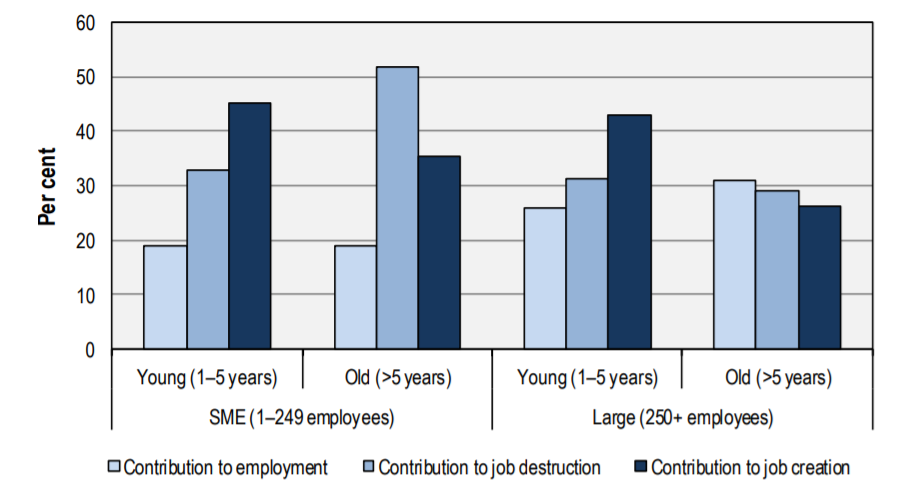
Employment, job creation, and destruction by enterprise age and size. OECD sample (2001–2011). Source: International Labour Office (2015, p. 10, Fig. 2.6).
Also, although young enterprises are “less likely to survive than older enterprises,” “the surviving young enterprises tend to have higher employment growth rates” (De Kok et al., 2011, p. 8). The second effect outweighs the first. Furthermore, the report adds that it is fast-growing SMEs that make the bulk of the contribution to job creation.1 According to that source, newly born enterprises add 17.5 jobs per 1,000,000 population on a net basis, while established enterprises actually destroy –4.2 jobs on net.2 Importantly, the likelihood of the survival of start-ups increases with their access to credit (FDIC, 2018, p. 45).
b) The importance of community banks for small businesses
For various reasons, obtaining external funding is not easy for SMEs. Unlike large firms, SMEs cannot access regulated capital markets at an affordable cost, for fees are much higher for small denomination issues (European Parliament, 2019, p. 2).3 Being unable to access capital markets, SMEs turn to banks as their only alternative for external funding of substantial amounts (SMEs tend to use internal funding and secondly borrow from family and friends first, but the amounts tend to be smaller) (OECD, 2018, p. 10). As a result, banks are the most common source of external funding for small businesses (FDIC, 2018, p. 18).
According to the Federal Reserve’s Availability of Credit to Small Businesses report:
“[S]mall businesses remain most reliant on banks for credit, as they overwhelmingly apply to banks more often than any other type of formal lender. Among businesses that applied for new credit in 2020, approximately 68% applied to a bank” (Board of Governors of the Federal Reserve, 2022, p. 30).
However, banks typically ask for collateral4 to reduce the loss given default of the borrower (it is estimated that around 50% to 70% of loans to non-financial firms are collateralized), but unlike larger firms, SMEs often do not have good-quality collateral to offer (Beck et al., 2015; Degryse et al., 2019, p. 1).
The top panel in the figure below shows data for U.S. banks. For large denomination loans, the collateralization ratio (defined as the collateral posted as a percentage of the loan principal amount) is much lower compared to small or micro loans.
As a result, banks prefer to deal with larger firms (Brown and Lee, 2014, p. 9; Mkhaiber and Werner, 2021; OECD, 2018, p. 6). Furthermore, bank lending is more profitable for banks the larger the loan amount, which itself tends to be proportional to firm size. In other words, by the nature of financial and profitability calculations, there is an unavoidable bias of bank lending in favor of the largest possible companies.
To compensate for this, banks tend to charge SMEs higher interest rates (OECD, 2018, p. 8)5 compared to large firms with better collateral or a longer credit history or a credit rating (see bottom panel below), and SME loan applications are rejected more frequently (European Commission, 2009).6
Top: Percent of value of bank loans secured by collateral, by size of loan. All commercial banks in the U.S. Source: FRED (St. Louis Fed). Bottom: Interest rate spreads between loans to SMEs and to large firms. Source: Financing SMEs and Entrepreneurs 2020 © OECD 2020.
Despite the fact that SMEs are reliant on bank loans to a greater extent than larger firms, the unattractive terms at which banks agree to lend to them result in SMEs applying less frequently and, therefore, receiving fewer loans relative to larger firms. Many SMEs are known to be discouraged in the first place, and some of them never attempt to borrow from banks. Evidence from the U.S. suggests that borrower discouragement is prevalent across SMEs (Han et al., 2009; Levenson and Willard, 2000), and younger and smaller firms are much more likely to be discouraged borrowers (Han et al., 2009).
In general, small banks are more flexible in underwriting start-up loans (FDIC, 2018, p. 45). For example, whereas 69.8% of large banks require a minimum loan amount for their loans to small businesses, only 14.8% of small banks do. Similarly, the percentage of large banks offering standardized lending products to small firms is 64.7%, whereas the figure for small banks is 8.4% (FDIC, 2018, p. 44). Small banks also tend to approve more loans to small businesses compared to larger banks (Board of Governors of the Federal Reserve, 2022, p. 35).
As a result, small banks (“community banks”7) tend to have small businesses as their counterparties, both as borrowers and as depositors. While big banks tend to deal with bigger customers, small banks tend to deal with smaller counterparties (Mkhaiber and Werner, 2021).
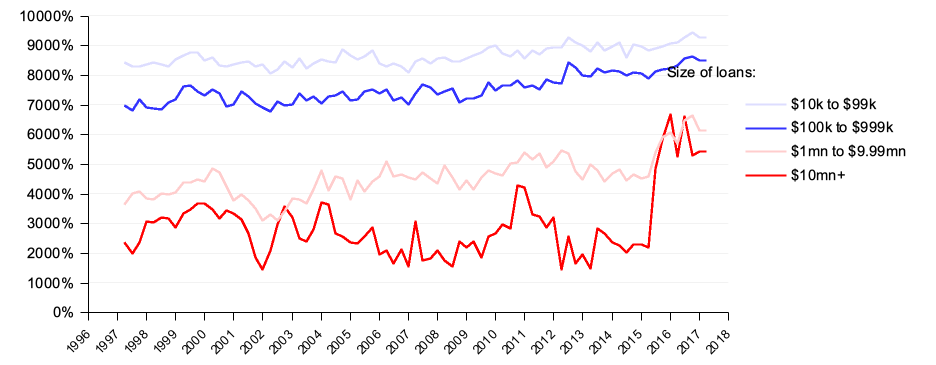
This is shown in the left panel below. The larger the size of the bank, the lower the share of smaller denomination loans in its total business loan portfolio, and the higher the average size of loans.
The right panel, in turn, shows the results of the FDIC’s 2018 Small Business Lending Survey. According to it, 86.4% of the smallest banks (banks with less than $250 million in assets) make commercial and industrial (C&I) loans almost exclusively to small businesses.
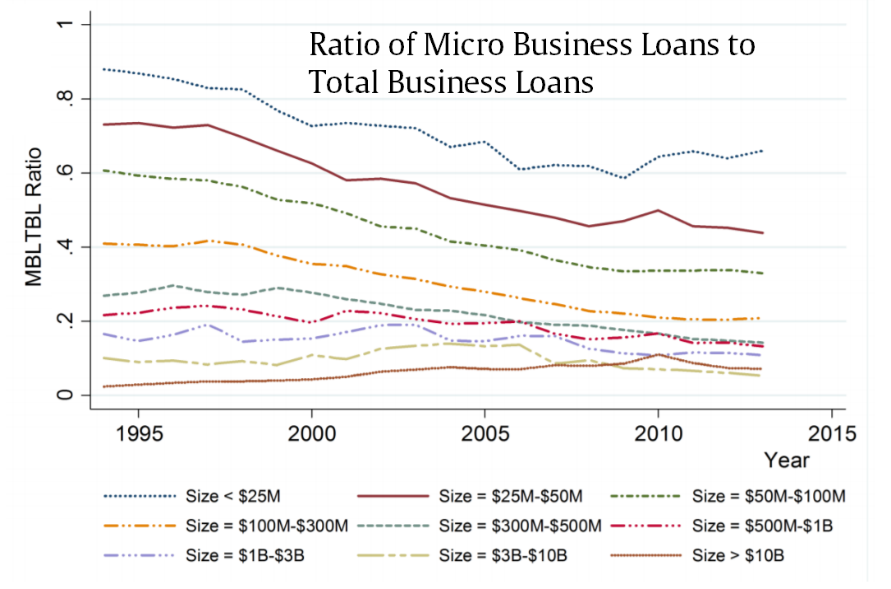
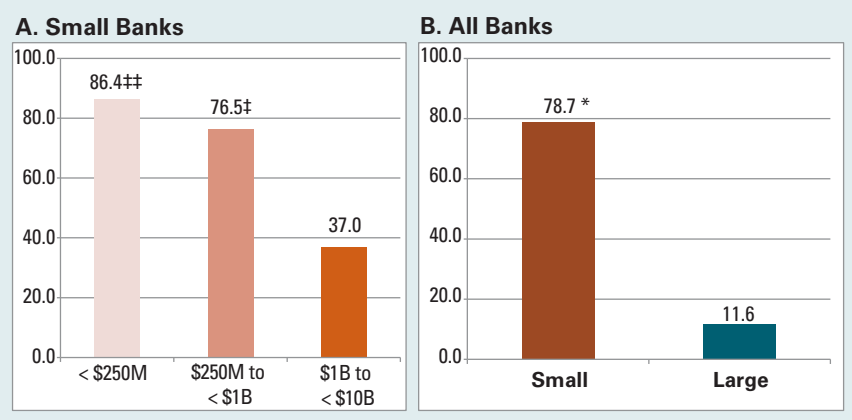
Top left: Ratio of micro business loans to total business loans. Each line represents the lending propensity of each of nine bank size groups over the period from 1994 to 2013 in the U.S. The lending propensity to micro businesses is computed as the ratio of Micro Business Loans to Total Business Loans (MBLTBL) for each size group. Source: Mkhaiber and Werner (2021).
Top right: Percentage of banks that make “largely all” of their commercial and industrial (C&I) loans to small businesses. Source: FDIC (2018).
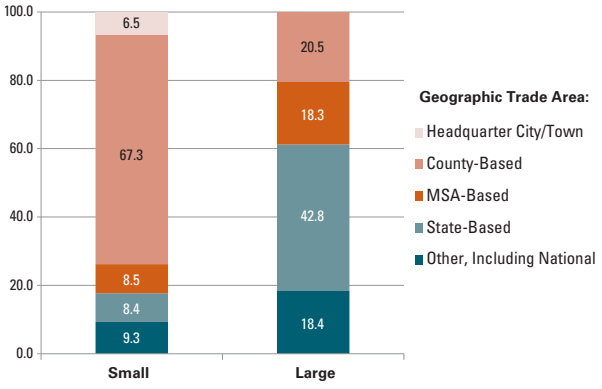
Bottom: Geographical trade areas of small and large banks. Source: FDIC (2018).
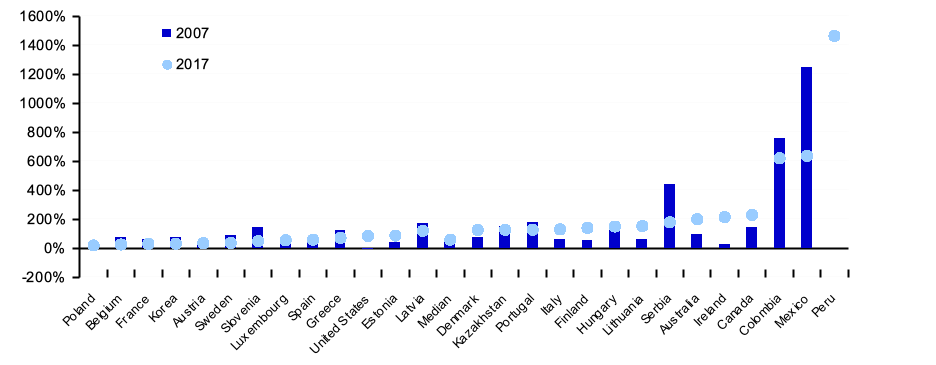
Another way to corroborate this insight that the existence of many small banks is necessary for a thriving small firm sector is to check how banking system concentration (measured by, for example, the share of banking system assets held by the five biggest banks) correlates with various measures of SMEs’ capacity to access finance and the terms on which they access it. Some are shown in the graphs below. As can be seen, in more concentrated banking systems, relative to bigger firms, SMEs tend to apply less for bank loans, their loan applications get rejected more often, and they get charged higher interest rates. As a result, the share of SME loans in total bank loans is smaller the more concentrated the banking system.
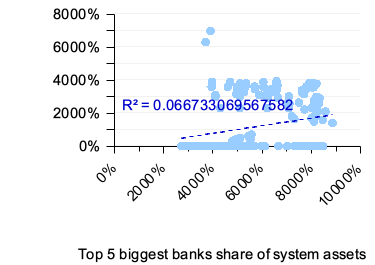
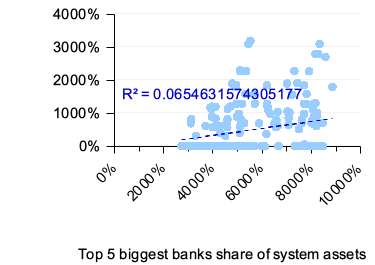
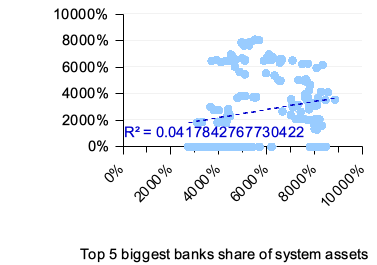
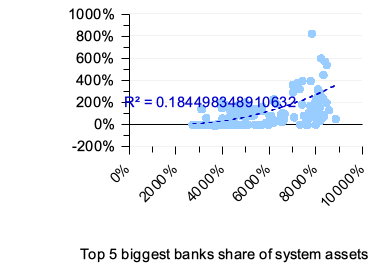
Data are for 15 OECD countries, 2007-2016 (source: OECD.Stat, Financing SMEs and Entrepreneurs: An OECD Scoreboard) and 45 countries, 2006-2017 (source: World Bank (2019), Global Financial Development Database). Complementary sources: Bank for International Settlements (BIS); SME Finance Forum.
The benefits of having many banks extend beyond facilitating access to finance. As shown below, the empirical evidence suggests that having a high number of banks per capita—which effectively means having a large share of the banking sector consisting of local, community banks—correlates with having a high number of highly competitive SMEs (called “Hidden Champions”; firms that hold a top-three market share in the world in their respective market niche; “hidden,” because they are unknown small firms) that are world leaders in their respective export markets. This is shown in the top panel in the figure below.
The case of Germany is illuminating. It is the country with the highest number of so-called Hidden Champions, both in absolute terms (1,300+) and per capita (16 per 1,000,000 residents) as of 2014. German export competitiveness is widely known. Less known is the fact that Germany is home to some 1,500+ banks (by far the highest number in Europe). Around 80% of these banks are locally-controlled, small, not-for-profit community banks.8 These small banks lend locally and to local SMEs, which account for a large bulk of German exports.
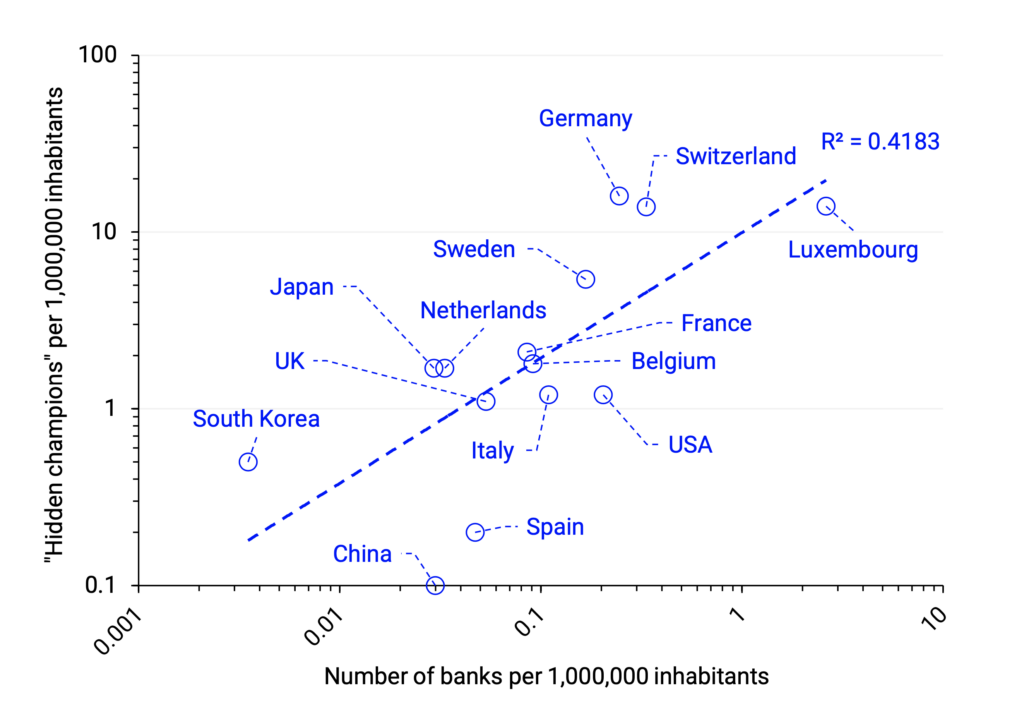
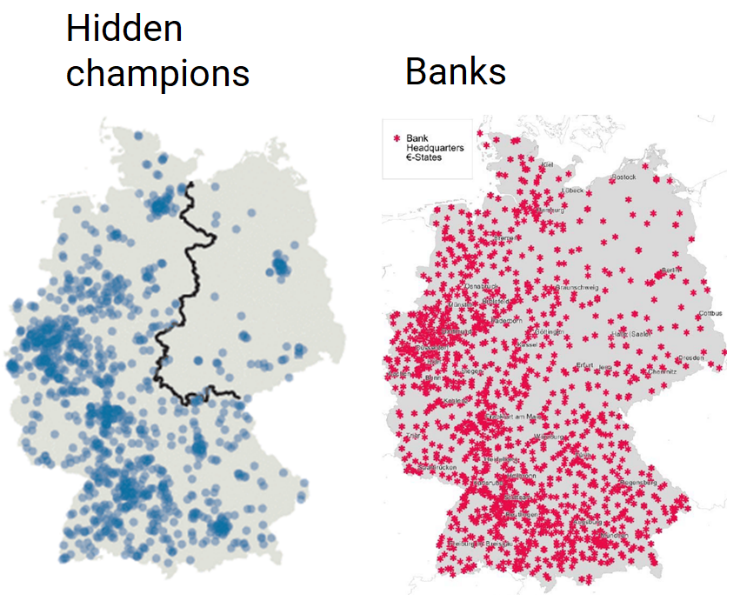
Top left: Number of hidden champions (vertical axis) and number of banks (horizontal axis) per 1,000,000 inhabitants. Data are for 2014. Sources: Simon, Kucher & Partners; BIS.
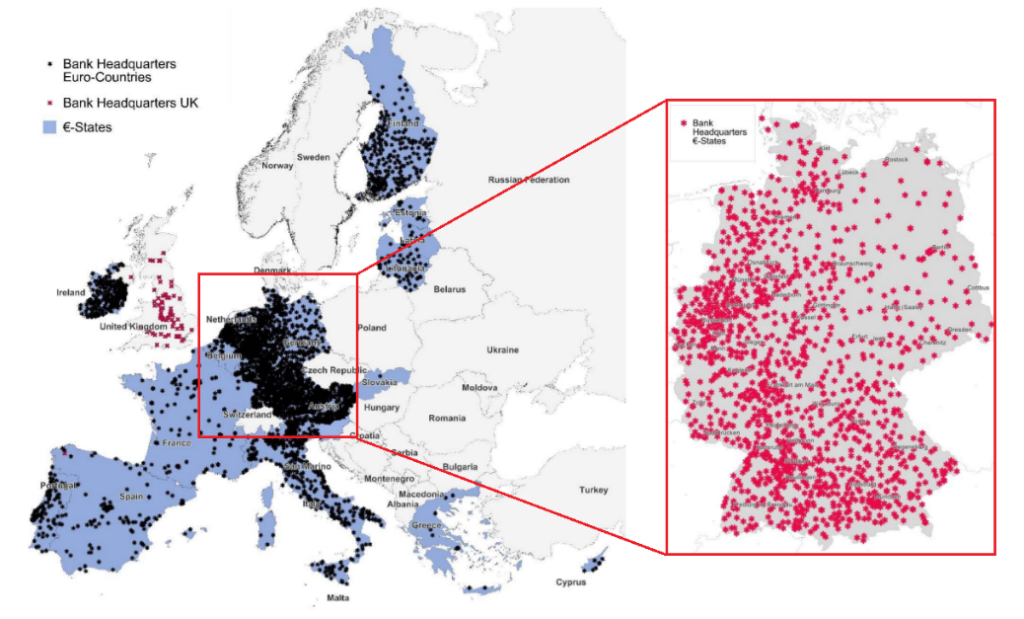
Top right: Bank headquarters. Source: Gärtner and Fernandez-Montoto (2018).
Bottom: Geography of hidden champions (source: The Economist (2019)) and bank headquarters (source: Gärtner and Fernandez-Montoto (2018)).
As shown above, small banks predominantly restrict their lending to the local, geographical area. As shown in the bottom panel in the previous figure, small banks focus on the city where they are headquartered (6.5%), on counties containing or near their branches (67.3%), or on metropolitan statistical areas (MSAs) containing or near their branches (8.5%).
Combined, 82.3% of small banks selected one of these local options. Large banks generally spread their resources across larger geographic areas than small banks, but a substantial minority is, like small banks, locally-focused. As the figure shows, large banks that describe their market area as at the state level constitute the largest share (42.8%) of large banks, and up to an additional 18.4% focus on the national level.
This is especially true in sparsely populated areas, where small banks tend to account for a higher share of deposits (Kodrzycki and Elmatad, 2011).9 This can be appreciated in the two graphs below.
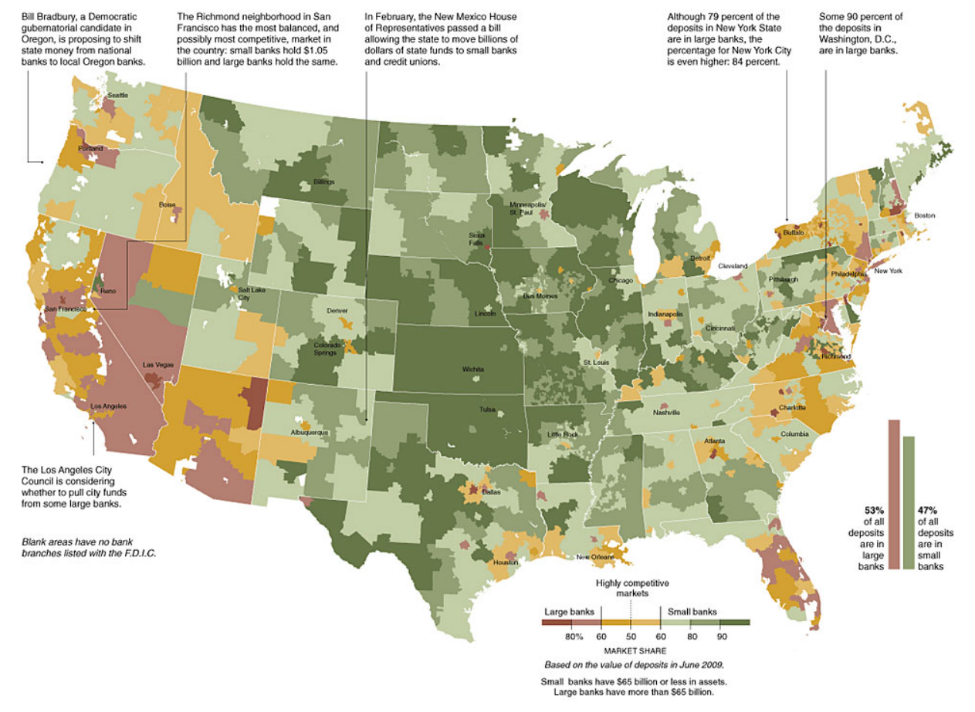
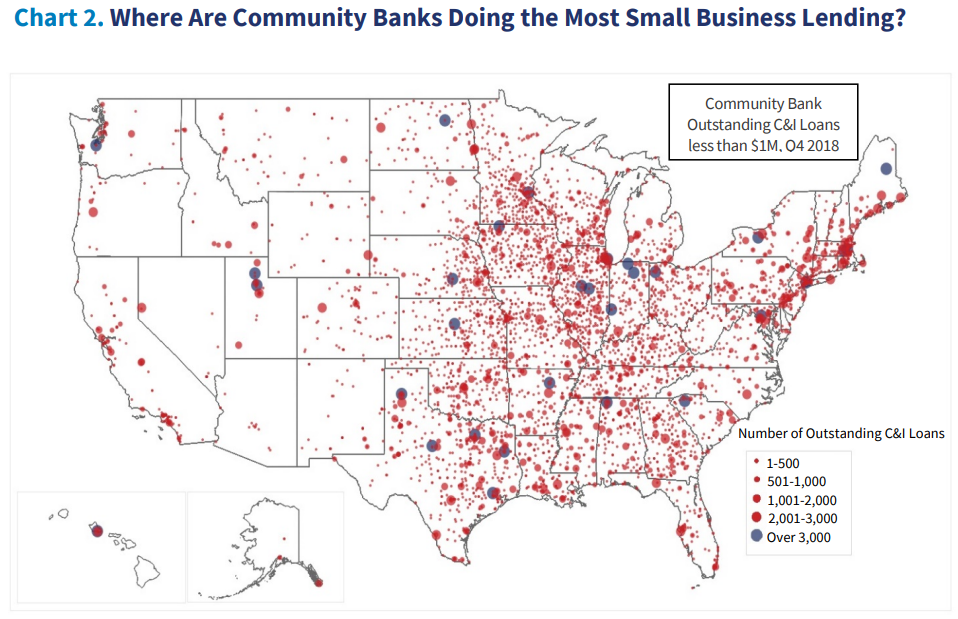
Left: Share of deposits held with large banks (red) and small banks (green). Source: The New York Times (2010). Right: Outstanding commercial and industrial (C&I) loans of less than $1mn granted by community banks, as of Q4 2018. Source: Brown (2019).
According to the Council of Economic Advisers (2016):
“Community banks play a key role in local access to banking services. About 1 in 4 counties rely exclusively on community banks for brick-and-mortar services within county lines. Almost half of rural counties have only community banks under the broad definition (under $10B in assets), with about 10 percent of these counties having only a single community bank office, or about 5 percent of rural counties overall.”
Community bank disappearance through mergers tends to reduce lending to small businesses. According to Jagtiani and Maingi (2019), who examined the U.S. economy,
“…local small business lending declined significantly more in counties where only the target had operations before the merger. … Overall, we find evidence that local community banks have continued to play an important role in providing funding to local small businesses. The absence of local community banks that became a target of a merger or acquisition by nonlocal acquirers has, on average, led to local small business lending credit gaps that were not filled by the rest of the banking sector.”
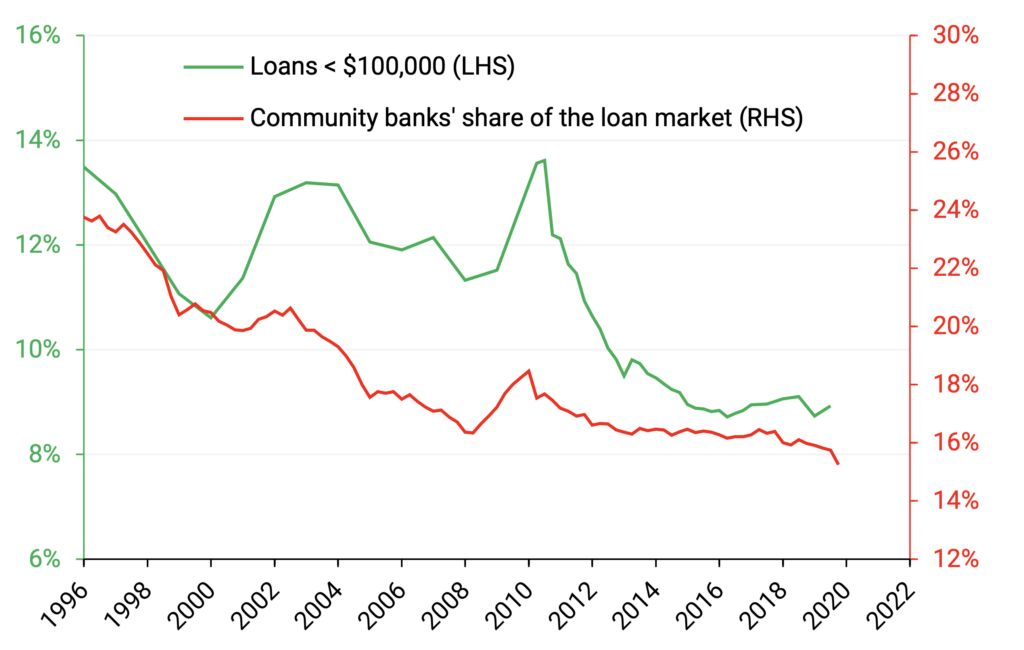
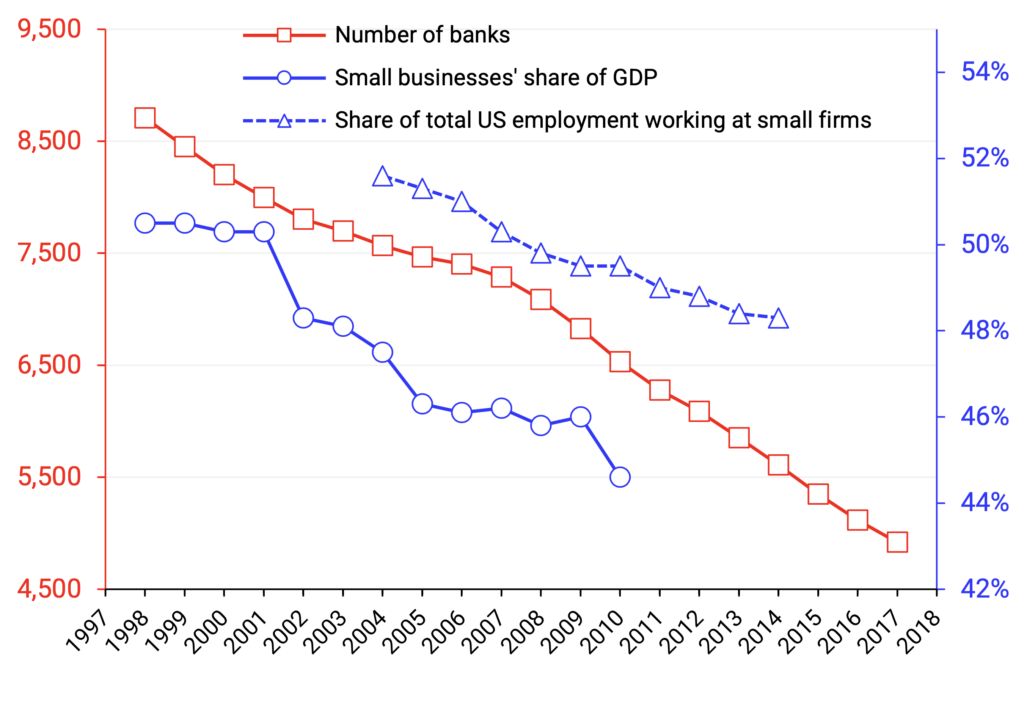
Evidence is presented in the two graphs below. The left panel shows that there is a strong correlation between the share of total employment accounted for by small firms and the share of the total deposits issued by small banks. In a similar vein, the right panel plots the share of loans of less than $100,000 denomination in all loans (green), and the share of community banks in the loan market (red), again showing a clear positive correlation (left panel), also showing a clear correlation.
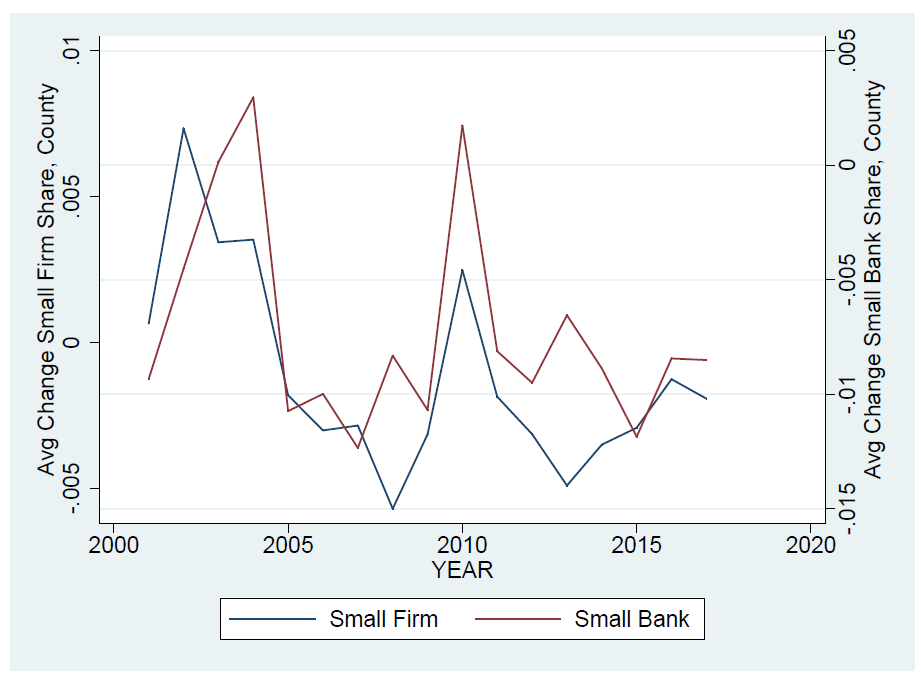
Top left: Average national changes in the small firm employment shares (blue) and small bank deposit shares (red) across counties. Source: Brennecke et al. (2020).
Top right: Market share of community banks in total bank lending in the U.S. (green) and the share of commercial and industrial (C&I) loans of denominations below US$1MM in total C&I loans (blue). Source: FDIC.
Bottom: Number of banks (red), small businesses’ share of U.S. GDP (blue), and share of total U.S. employment working at small firms (discontinuous blue). Sources: JP Morgan Chase; FDIC.
As a response to this, community banks have shifted their loan portfolios increasingly to real estate loans since the 1980s to a greater extent than big banks.10 Two important reasons for this seem to be, first, collateral is easier to obtain, and second, the real estate sector is “less associated with relationship-lending” (Brennecke et al., 2020). This is not a positive development, since bank lending for business investment is non-inflationary and avoids financial crises, whereas bank lending for asset purchases (including mortgages to purchase existing dwellings) creates asset price inflation and heightens financial instability. This trend can, however, be reversed through the existence of a state bank that acts as lender and counterparty to small local banks and that can encourage bank lending to SMEs for productive business investment, while discouraging bank lending for asset purchases and for consumption.
c) Developments in the U.S. and Tennessee community banking sector
Unfortunately, the number of banks in the U.S. is in a decades-long downward trend, as shown in the top-right graph below. Since the 1990s, the banking industry has been in a path of consolidation, a process that was somewhat halted after the great financial crisis of 2008-09, but not reversed (top-left panel). As has been shown above, banking system concentration is generally bad for small businesses. The start of the drop in 1985 also coincided with the trade deficit in the U.S. becoming a structural problem and the loss of thousands of domestic jobs across the U.S.11
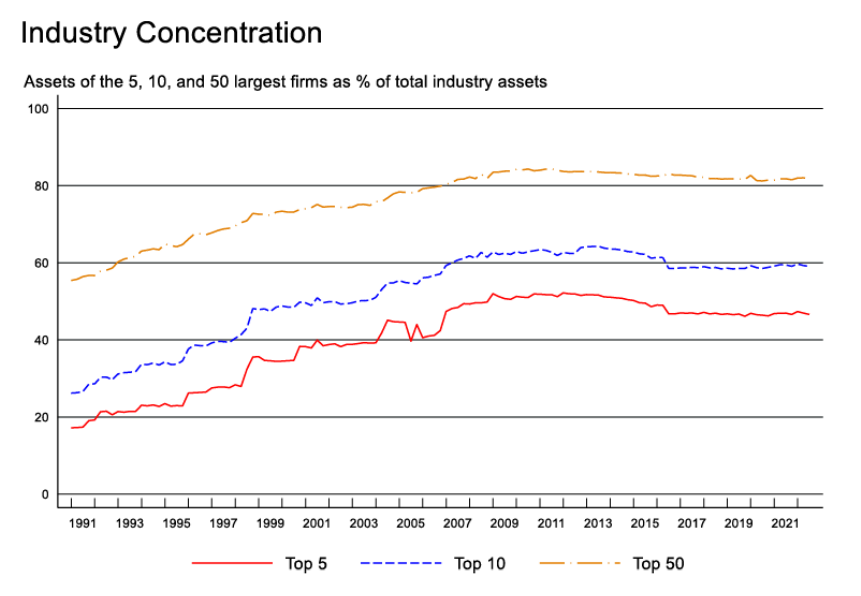
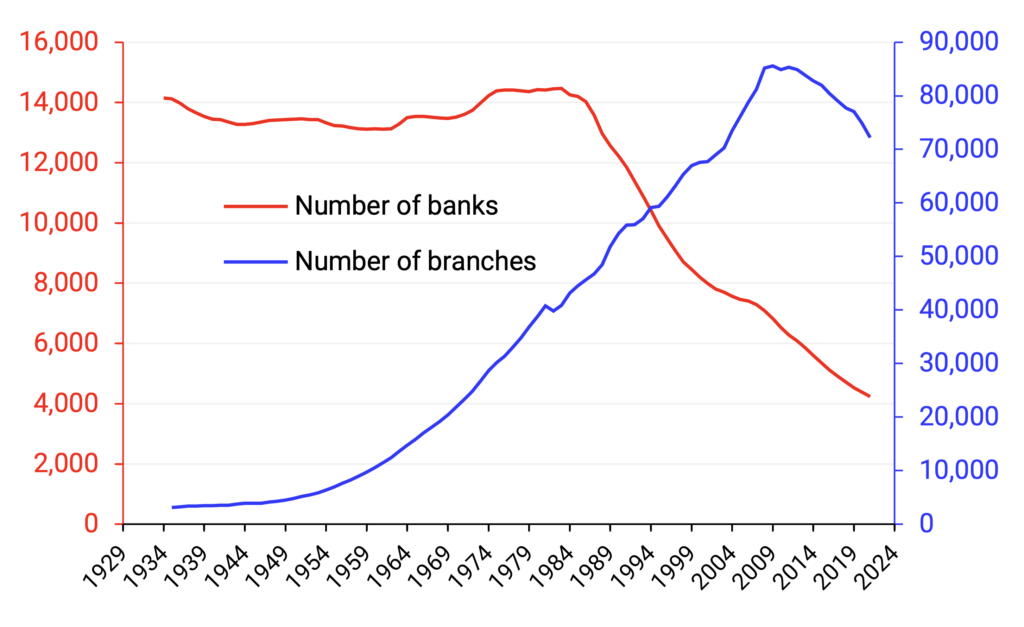
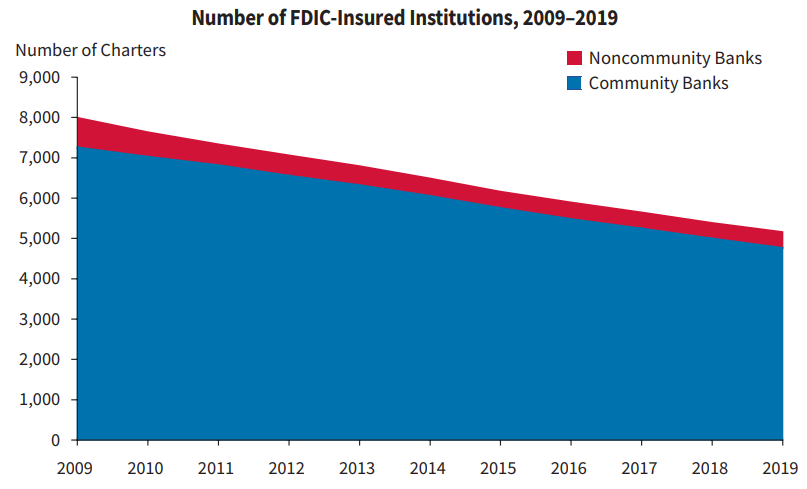
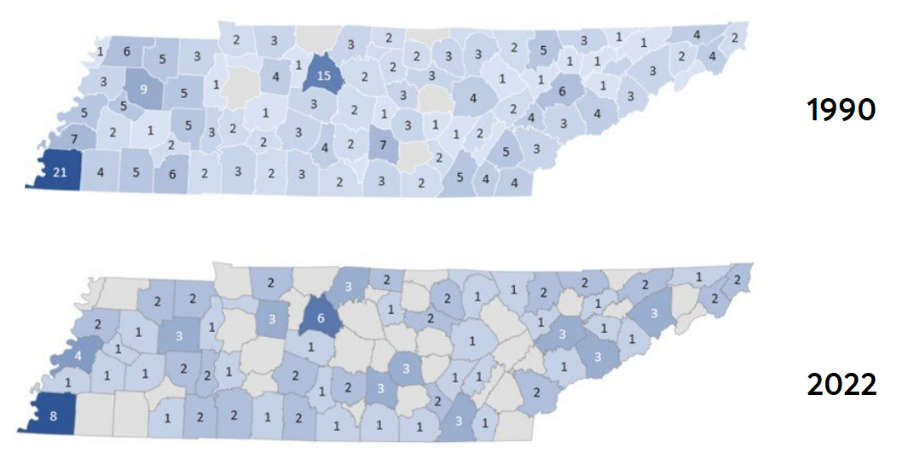
Top left: Banking industry concentration, % of assets of biggest banks. Source: Federal Reserve Bank of New York, Quarterly Trends for Consolidated U.S. Banking Organizations (2022). Top right: Number of banks (red) and branches (blue) in the U.S. Source: FDIC. Bottom left: Number of banks (community and non-community) in the U.S., 2009-2019. Source: FDIC (2020). Bottom right: Number of community banks by county in Tennessee. Source: Banking Strategist.
As a result, the drop in the total number of banks is almost fully accounted for by a drop in the number of community banks (bottom-left panel). The same is true in Tennessee (bottom-right panel), where the number of community banks has dropped substantially in the last decades, from more than 350 in 1990 to 120 in 2022 (a 65% drop).
This contraction is due to two factors:
-
The lack of entry of new community banks into the market (new bank charters).
-
The disappearance of existing community banks, notably through mergers.
Both factors have played a role, as shown next.
Lack of entry
Since the financial crisis of 2008-2009, the number of new bank charters has been modest as very few new banks have entered the market.
One of the reasons for the lack of entry is the central bank policy of extremely low interest rates and the heightened regulatory burdens on banks. According to Adams and Gramlich (2014),
“Interest rates are known drivers of banking profitability, and regression results suggest that these rates – plus other non‐regulatory influences such as weak banking demand – are likely to have caused 75‐80% (or perhaps even more) of the current decline in new charters.”
The graph below shows the number of new charters and the Fed funds rate.
Conversely, the present rising interest rate environment is an ideal time to establish new banks, and reverse this concerning trend toward fewer and larger banks.
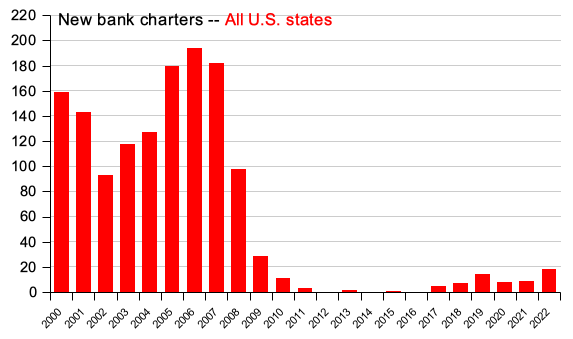
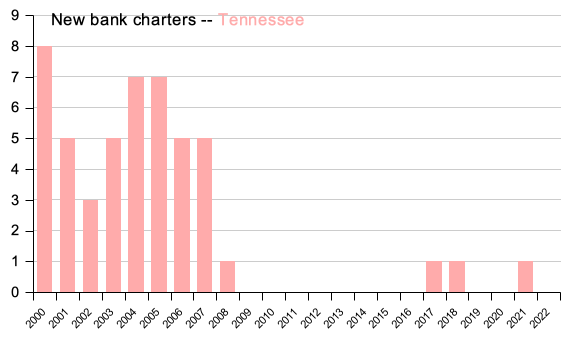
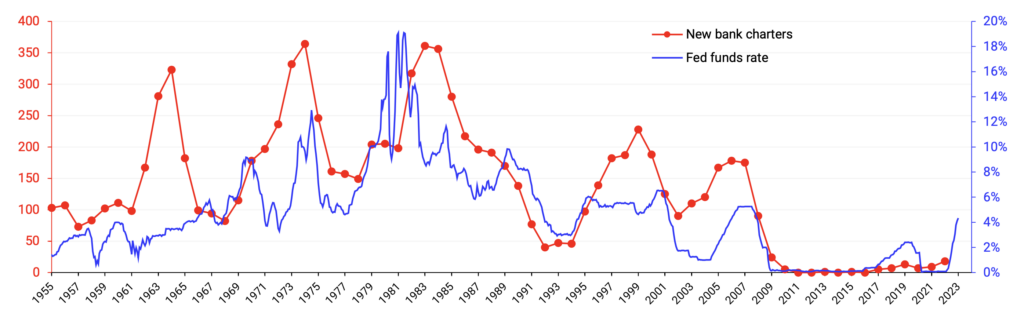
Top: New bank charters per year in the U.S. (left) and in Tennessee (right). Source: FDIC. Bottom: New bank charters per year (red) and Fed funds rate (blue). Sources: FDIC, FRED.
Mergers
The three primary ways a bank exits the market are mergers (through both consolidation and acquisitions), failures, and liquidation. The figure below shows that much of the exit in 1994-2014 occurred in the form of mergers with other community banks, underscoring that many are thriving. The number of bank failures rose in 2008 and 2009 as the Great Recession took hold before starting to drop off, and the number of failures are now roughly in line with those in the decades prior to the Great Recession. The fraction of mergers between community banks that merge with other community banks has risen from almost 40% in 1994 to 65% in 2014.
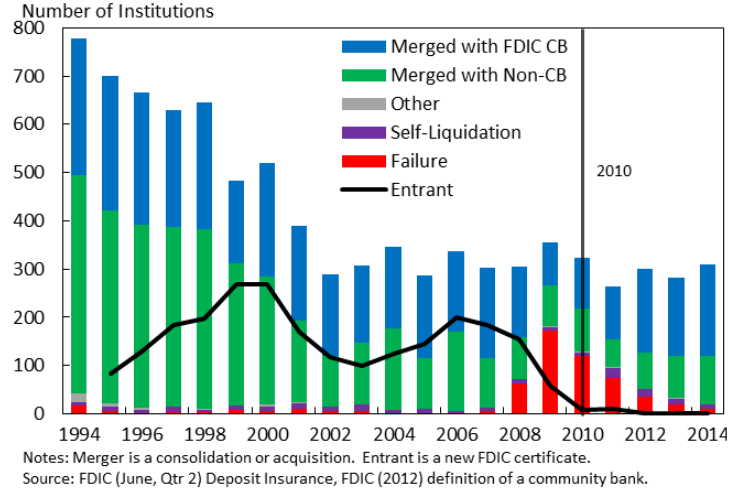
Reasons for exit of banks with total assets < $10 billion. Source: Council of Economic Advisers (2016).
The largest contributor to negative growth in the number of banks in the smallest size category was increasing asset class—banks moving up to a larger asset class (Council of Economic Advisers, 2016). As we have seen, the bulk of the reduction of the number of banks can be attributed to the decreasing number of community banks. In other words, since banking is highly profitable and thus banks tend to grow in size over time, it is always necessary to establish new banks. Another argument is made by Brennecke et al. (2020), according to whom consolidation in the banking industry is “at least partially driven by consolidation on the real side of the economy.” As the economic footprint of small businesses in the U.S. decreased over 1998-2015, so did the number of banks.
Creating a state bank would establish economic and financial stability on the state level that would facilitate the creation of many new small banks, which in turn would ensure the continued entry of new businesses and the job creation from small firms being able to expand due to sufficient funding from small local banks.
IV. What Is a Sovereign State Bank?
A sovereign state bank is generally understood as a bank that is majority-owned by the public sector, either by the central government or some other governmental level like a state or a local government (e.g., county-level).
There are at least two types of government-owned banks:
-
Upper-tier banks, which compete with larger banks and act as intermediaries between the government and the central bank on the one hand, and smaller banks on the other.
-
Lower-tier banks, which compete with smaller banks and have households and non-bank firms as their customers. 12
This is shown below.
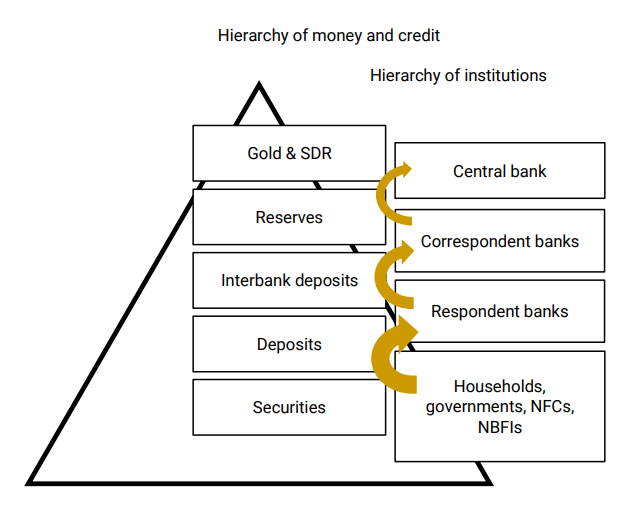
The hierarchy of money and credit. At each level, what constitutes a debt (a liability) for some entities constitutes money (an asset) to those lower down below. For example, reserves are the liability of the central bank, but an asset of correspondent banks, who use them to make payments to each other. Similarly, deposits issued by respondent banks are used by non-banks (households, governments, and non-bank financial institutions) to make payments to each other. The arrow size is roughly proportional to economic value.
While there is ample literature discussing the merits and relative performance of government-owned versus private-owned banks,13 most of this literature fails to distinguish between upper-tier and lower-tier banks, which have very different characteristics and their effects on an economy differ.
Upper-tier banks operate as more central organizations to support the lower tier of decentralized local banks. History shows that small local banks thrive when there is a regional or state-level upper-tier bank, such as the Bank of North Dakota, that cooperates with them in a complementary fashion, while in principle not competing directly with them, rendering both the upper-tier bank stable and profitable, and ensuring a thriving decentralized economy with many small local banks that are agile and capable of fulfilling their task of inspecting thousands of small and micro enterprises with a view to extending small firm loans.
In this report, the establishment of an upper-tier state-level bank is proposed that is majority-owned by the Tennessee State Government (TSG). The model has as its role model the Bank of North Dakota (BND), described below.
As an upper-tier state-level bank, the State Bank of Tennessee will not only act as a counterparty and supporter of small local banks, but will perform a variety of important financial and economic tasks for the Tennessee State Government. This includes the roles of acting as a banker to the State of Tennessee and facilitating funding the state-level borrowing requirements, while also engaging with state-level projects and enterprises. In addition, it is proposed that the State Bank of Tennessee act as a depository for the State, and additionally for the banks incorporated in the State of Tennessee. The role of depository comprises both the standard custodial function for the holding in trust of securities and keeping record of ownership and liens in collateral. The depository services should also include the storage and custodian services for bullion and precious metals, which provides an anchor that transcends the volatility of short-term financial markets or federal-level monetary or fiscal policies.
V. Benefits to Tennessee
a) Local banks, savings banks, and credit unions
In Tennessee, 10 banks account for 64.2% of the deposit market (slightly above the U.S. average of 60%). We find that the banks active in Tennessee can be divided into two major categories, namely those banks for which Tennessee is a small share of their deposits (upper-left corner in the figure below) and those for which Tennessee accounts for most of their deposits (bottom-left corner). The first cluster tends to be large, interstate banks, with average deposits of $184 billion each. The second cluster tends to be community banks (defined as those banks with <$1 billion in assets and the majority of their deposits booked in Tennessee), with average deposits of $356 million, 86.9% of which are booked in Tennessee.
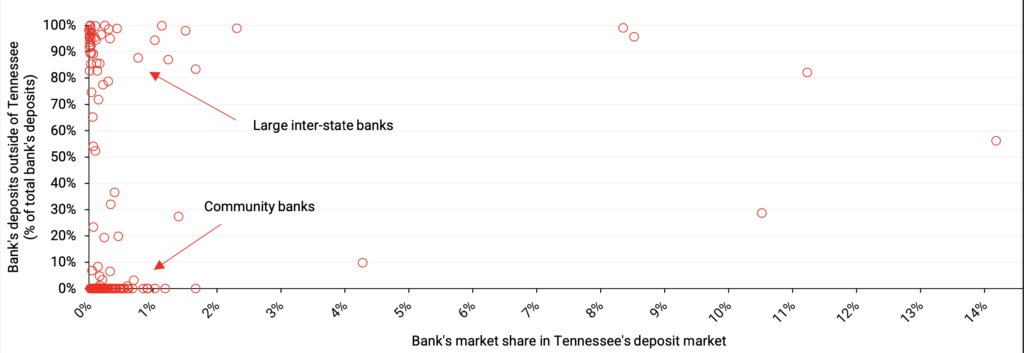
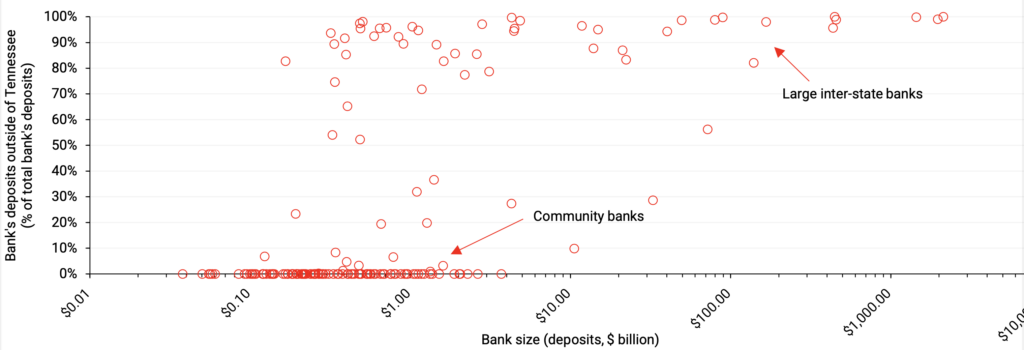
Banks active in Tennessee, June 30, 2022. Source: FDIC Deposit Market Share reports.
The introduction of a State Bank of Tennessee would help community banks in Tennessee compete against larger banks, by helping them fund larger-scale projects through loan participations with SBT and loan purchases by SBT. In the case of loan participations, SBT would act as the “lead bank” arranging the syndicated loan for large-scale projects in need of financing, and the community banks would be part of the remainder syndicate of lenders participating in the deal. In the case of loan purchases, community banks would act as loan originators, using their local, more detailed on-the-ground (“soft”) information about borrowers to evaluate their creditworthiness, probability of default, etc. (for which they have an advantage over large banks, including SBT), and SBT would agree to purchase some of those loans from community banks ex post facto.
Additionally, local banks would benefit from the existence of the State Bank of Tennessee by being able to use their accounts at SBT to settle transactions between them, very much like a central bank often acts to provide the clearing and settlement system for bank transactions. This would improve the efficiency of local banks.
b) Local economy and Tennessee GDP
The existence of the State Bank of Tennessee would result in an increase in total bank loan funding from both the state bank itself, including in the long run to large-scale projects via loan participations, as well as from the many local community banks to small business. We estimated one scenario as follows. In the initial five years, the impact of increasing local bank funding to small firms could amount to approximately $7bn in new lending from the local banks, as it is proposed to kick-start the operations of the State Bank of Tennessee by an initial one-off purchase of 20% of the loan book of all local banks, extracted by size (namely, selecting the largest 20% of loans). The estimated cost to the State of Tennessee would amount to ca. 1.07% of TSG annual revenues, namely $500 million. This one-off investment would be recouped within approximately four years from returns on equity, after which the State of Tennessee would henceforth receive annual dividends as profit from its investment.
The initial investment of $500 million in share capital injected into SBT would translate into a balance sheet size of ca. $10 billion, after two years, of which about two-thirds (about $6.7 billion) would contribute to additional funding to Tennessee’s businesses (assuming that the local banks would replace the sold loans with new lending of similar proportion within about two to three years).
Importantly, such funding for small firms would be used for productive purposes, leading to higher gross fixed capital formation and thus higher GDP (see Section VIII), as well as a significant increase in job creation. It can be estimated that at least ca. 15,000 to 20,000 jobs would be created in the first five years after launching the State Bank of Tennessee, depending on specific operating policies adopted.
c) State and local government
The State of Tennessee and local governments in Tennessee would benefit from the existence and operation of the State Bank of Tennessee in a number of ways:
-
Dividends: With Return on Equity (RoE) of ca. 18%, the State Bank of Tennessee would, after the first three years of establishment and operation, be able to pay a return of ca. $18 million on $100 million in capital invested, every year.
-
Higher state-level tax revenues: Tax revenues are proportional to value-added activities and nominal GDP. The positive effect on Tennessee GDP should thus also raise state-level tax revenues.
-
Greater job creation and higher labor participation: While Tennessee does not have significant structural problems with job creation and unemployment, the launch of the State Bank of Tennessee would ensure that job creation will remain strong in the long run and that labor force participation can likely be raised further, as more local and rural residents no longer counted as part of the workforce are hired by small firms.
-
Greater local autonomy and resilience to shocks from outside of Tennessee: The state bank effectively would act as a buffer against shocks from outside Tennessee to the financial sector in Tennessee. It is well-documented how “contagion” can affect large financial centers such as New York, Chicago, and Los Angeles, and spread to regional financial institutions. However, by positioning the State Bank of Tennessee as a reliable and dedicated correspondent bank for all locally headquartered banks in Tennessee, they would be shielded to a significant extent from the potential adverse effects of outside shocks. Such shocks include policy changes and the introduction of new instruments by the Federal Reserve or federal policy-makers that may otherwise adversely affect local community banks. The State Bank of Tennessee would render the State of Tennessee able to act quickly to respond to potential future adverse policy decisions taken outside Tennessee, for instance via the use of its bullion depository function or by acting as a counterparty to Tennessee community banks even in the case of devastating cyberattacks on the U.S. banking system. On the local level, non-digital analog systems can be introduced quickly as temporary measures in such adverse cases, but their likelihood of being viable would be significantly enhanced if they were backed by a larger counterparty, which role the State Bank of Tennessee would play.
Importantly, it is advised that the State Bank of Tennessee, like the Bank of North Dakota, not join the Federal Deposit Insurance scheme. Instead, deposits should be guaranteed by the full faith and credit of the State of Tennessee (as is the case in North Dakota). This will limit the control and influence that federal agencies can exert over the State Bank of Tennessee (the Federal Deposit Insurance Corporation, for instance, has the power to shut down even healthy banks).
-
A greater variety of options concerning funding the public sector borrowing requirements for the state and for local governments: The State Bank of Tennessee could be active in underwriting state and county debt, reducing borrowing costs, increasing liquidity, and facilitating funding arrangements, while at the same time increasing the positive impact of fiscal measures on the real economy (bank-funded public sector borrowing has a much larger impact on economic growth than bond-funded public sector borrowing, see Werner, 2014c).
-
Direct support of existing state-level policy programs: The State Bank of Tennessee could support all State of Tennessee economic assistance and policy programs by providing for a facility to offer development and directed lending for specific purposes, while ensuring commercial terms and financial viability.
d) State pension funds
The State Bank of Tennessee could act as the custodian of state pension funds, thereby ensuring that a greater proportion of the investments end up back in the State of Tennessee, where they benefit all Tennessee stakeholders more directly than investments outside of Tennessee.
The existence of the State Bank of Tennessee and its function as hub bank for all Tennessee local and community banks also would allow the state pension funds to increase their options for investing in the Tennessee economy, namely by investing in bonds issued by the State Bank of Tennessee, but also by joining directly some of the larger loan syndications arranged by SBT with local banks. Overall, the existence of the State Bank of Tennessee is likely to see a greater awareness of and actual investment in the opportunities available for investors in Tennessee, which benefits all stakeholders.
e) Citizens
The ultimate beneficiaries of the above-listed benefits would be the citizens of Tennessee. In addition to benefiting indirectly from the above, citizens also would benefit directly from the consequent greater vibrancy of the small and local banking sector, the likely increase in the total number of community banks (since the creation of the State Bank of Tennessee is likely to result in a wave of new community bank foundations), and the greater job creation by small and medium-sized companies in Tennessee that are able to expand faster, hiring more staff.
The bullion depository function of the State Bank of Tennessee could be arranged as a two-tier system, whereby customers of local credit unions and community banks would deposit gold with their local banks, and these in turn would deposit their own and customers’ deposits with the State Bank of Tennessee. An alternative would be to organize the State Bank of Tennessee bullion depository function to include direct retail deposits. A combination of both is also possible.
Citizens would also benefit from the role the State Bank of Tennessee could play in ensuring that cash cannot be phased out entirely (see the following section).
As is the case in North Dakota, the State Bank of Tennessee could offer a variety of disaster assistance lending programs that benefit its citizens.
In the future, if the State leadership so decides, it would also be possible to make shares in the State Bank of Tennessee available to residents of Tennessee, for instance, when a capital raise is planned by SBT. Publicly offered shares could be a different share class. There could be rules restricting such shareholdings only to natural persons and/or legal persons domiciled in Tennessee, for instance. However, it should be the aim for the State to always hold at least 50% of the shares.
VI. Risk Management
a) State requirement to take cash
Several U.S. states have acted to protect the use of cash. Legislators in the State of Tennessee proposed a bill in 2022 (Senate Bill 1858) that would have required all businesses to accept cash for goods and services should the buyer wish to pay in cash. This was important legislation as it would have ensured that cash cannot be phased out. The ability to pay in cash guarantees certain minimum freedoms and hence human rights (which include the right to privacy).
Senate Bill 1858 would have amended existing code to ensure that “legal tender” could not be refused. This proposed legislation followed precedent set by several other states that have required businesses to accept cash payments, namely Arizona, Colorado, Connecticut, Delaware, Idaho, Maine, Massachusetts, Michigan, New Jersey, New York, North Dakota, Oklahoma, Pennsylvania, and Rhode Island; all have passed legislation favoring cash as a form of payment. Additionally, cities such as Washington DC, Berkeley, Chicago, New York City, Philadelphia, and San Francisco require businesses to accept cash payments.
The existence of a State Bank of Tennessee that has in its articles of association a statement that promissory notes and paper money as well as coin, including gold and silver coins, will be accepted at their market value, will provide certainty for individuals, traders, businesses, and local banks that there is a depository of “last resort” that will accept cash, hence ensuring that cash cannot be entirely eliminated. Moreover, it offers a practical mechanism for ensuring that a cash and/or bullion economy and means of payment develops, assuring liquidity, credibility, and certainty.
b) Protection against CBDCs
The establishment of the State Bank of Tennessee would mark an important step to counter the ongoing and Federal Reserve-led program of consolidation of the U.S. banking industry: Over the past 30 years, more than 10,000 banks have disappeared in the U.S., mostly small local banks.
Moreover, establishing the State Bank of Tennessee offers an important measure to counter the recent move by the Federal Reserve system to explore the introduction of a USD central bank digital currency (CBDC).
Central bank digital currencies are named to distract from their true nature. Firstly, they give the impression that digital currencies are a novelty, but in actual fact, bank digital currency (BDC) has been in circulation as the main means of payment for many decades. What is novel is the centralization aspect, the programmability and unprecedented technology for total surveillance and micromanagement of all transactions in the economy via this new tool. As Catherine Austin Fitts has argued, “CBDCs are not currencies, they are a control tool.”
What is also novel is that the most influential bank regulator, the Federal Reserve system, is preparing, via the issuance of CBDCs, to step into the arena and compete against the banks it regulates. It is as if the umpire in a football game were to decide to run after the ball himself, while using his powers to stop the contenders, ensuring that he will score all the goals. For what the name distracts from is that essentially central banks issuing CBDCs will offer current accounts at the central bank to the general public, thus directly competing against the banks. This is historically unprecedented, as it breaks the centuries-old tradition that the central bank acts as a wholesale bank in a two-tier system in which the general public and companies will not deal with the central bank, but the commercial banks. Should such retail CBDCs ever be introduced, it is apparent how only a minor financial crisis could result in a massive shift of bank deposits away from commercial and local banks to the Federal Reserve digital currency deposit accounts, rendering the banking system defunct within a short time period. To put it mildly, CBDCs thus could adversely affect the capacity of banks for funding themselves with deposits and trigger deposit outflows from private bank deposits onto the central bank balance sheet to CBDC accounts. Conservative estimates by proponents of CBDCs are that their introduction could lead to outflows equivalent to 5% to 10% of bank assets (García et al., 2020) and 20% of household and non-financial deposits (Bank of England, 2021).
Necessary protections against CBDCs are the availability of sales transactions settled in cash—for which the State Bank of Tennessee would provide valuable support—and state-level financial gravity allowing state legislators and the private sector in the state to organize payments outside the CBDC system. Again, the State Bank of Tennessee would provide a crucial supporting or even central role in any such schemes. Finally, should CBDCs be introduced, then states without a state bank will find that their state-domiciled banks will disappear quickly, leaving the entire state economy beholden to the programmable micromanagement of the Federal Reserve. States with a state bank, such as North Dakota, will find that their local banks can survive, even when an external shock drives personal deposits away from local banks to the Federal Reserve’s CBDC accounts. On the one hand, the state bank can substitute for dwindling local deposits by purchasing bank bonds. It also can assure depositors that the local state-level banks are strong, thanks to the backing of the state bank. These backup functions of the state bank are further enhanced by its cash and bullion depository function.
c) Protection of financial transaction freedom and privacy
Banks have access to an enormous amount of historical and ongoing current information about depositors and their digital transactions. This wealth of information is precisely what a CBDC system targets and aims at using as a surveillance tool as well as for the programmable direction of individual behavior through the central planners.
The State Bank of Tennessee should have in its statutes that it protects privacy and will not use transactional information for any purpose outside of technical banking requirements.
By providing a bulwark in defense of cash, precious-metal hard money, and locally-anchored community banks, the State Bank of Tennessee offers protection against financial intrusion from outside the State of Tennessee and can protect individual freedom and privacy.
d) Comments on related digital systems: banking and telecommunication systems and state-controlled cloud
Modern core banking IT systems often use cloud computing and cloud storage of data. The servers physically storing the data are in a growing number of cases the giant data storage services offered by Amazon Web Services (AWS). Microsoft, Google, and Oracle (which provide significant cloud services to the Department of Defense, Navy, and U.S. agencies and intelligence services) are similar organizations thriving on accumulating and utilizing Big Data.
This concentration of data storage significantly heightens concentration risks in the financial system that could emanate from rogue access to or use of such data, as well as cyberattacks to down the system. In addition, central data storage at AWS cannot be expected to be secure from prying by secret services, such as the CIA, with which Amazon has a long-standing and close business relationship to provide consolidated cloud services to 17 U.S. intelligence agencies.
It is strongly recommended that the State Bank of Tennessee have its own high-security data storage center, which can be offered, at a fee (and hence will be profitable), to the banks headquartered in Tennessee. This ensures that the State of Tennessee can significantly enhance its resilience to any cyberattack affecting the large nationwide or federal banking networks. The State Bank of Tennessee can effectively host the core of what could be a state-controlled secure and independent cloud storage system that will enhance state-level autarky in the sphere of IT and data communications as well as banking and financial transactions.
VII. History of State Banks
a) The Bank of North Dakota
The Bank of North Dakota (BND) is unique as it is the only remaining state-owned bank in the continental United States of America. Although it has played various roles since its founding in 1919, BND’s most important role has been to serve as a lending partner for North Dakota’s many small banks. The majority of BND’s loan portfolio consists of loan participations and loan purchases from community banks. In addition, it holds student loans (Kodrzycki and Elmatad, 2011).14 The Bank of North Dakota has only one location and does little retail banking, so it complements rather than competes with banks (Collins, 2018). It also holds the deposits of the state and certain agencies, and provides disaster assistance lending through numerous programs (S&P Global, 2021).
It participates in business loans largely originated by other North Dakota banks. This arrangement implies that local private banks have an informational advantage over BND in determining the creditworthiness of North Dakota borrowers. However, without the participation of another lender such as BND, local banks might be unable to meet the demand for relatively large-scale loans (Kodrzycki and Elmatad, 2011).
For example, BND may act as lead financial institution to initiate financing to large-scale projects (e.g., loans in the $10-$75mn range), and guarantee 30% to 50% of the loan amount, so that smaller lenders (community banks) are encouraged to participate. The scheme achieves bond-type interest rates without going to the market.15
Bank of North Dakota is owned and operated by the State of North Dakota under the supervision of the Industrial Commission as provided by Chapter 6-09 of the North Dakota Century Code. BND is a unique institution combining elements of banking, fiduciary, investment management services, and other financial services, and state government with a primary role in financing economic development (Kodrzycki and Elmatad, 2011). The North Dakota legislature determines appropriations from the general fund every legislative session, and the amounts designated from BND’s capital will vary based on the state’s needs and BND’s capital and liquidity levels. However, these dividends have typically not exceeded net income by a large enough amount to significantly impact capital levels (S&P Global, 2021).
BND is a participation lender; the vast majority of its loans are purchased from financial institutions throughout the State of North Dakota.16 BND’s primary deposit products are interest-bearing accounts for state and political subdivisions. Deposits held at the Bank are not covered by depository insurance, but rather are guaranteed by the State of North Dakota as described in NDCC (BND, 2021).
The following table shows BND’s loan portfolio composition. Participations account for 43% of BND’s credit exposure (BND, 2021).
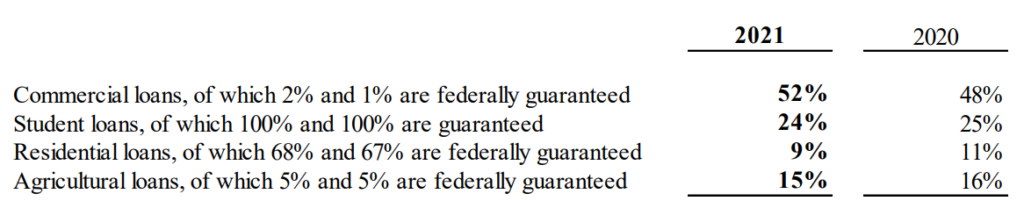
Bank of North Dakota loan portfolio composition. Source: BND (2021).
Importantly, in other states, community banks face competition from large private banks that have greater lending capacity and offer a wider array of services to business customers. Since BND does not compete in the same ways as private banks, its presence strengthens the role of community banks in North Dakota and limits the influence of nationwide and international banks (Kodrzycki and Elmatad, 2011).
In 2010, BND had total assets of $4 billion and total deposits of $3.1 billion. BND has shown a profit each year, according to data available since 1971. In fact, BND has consistently produced high returns on its assets compared to similarly sized private banks. BND accounts for about 15% of the total deposits of banks with operations in North Dakota—more than any other bank in the state. Almost all of BND’s deposits are attributable to state government, which is required to deposit its cash reserves in BND. Although the bank is allowed to accept deposits from many other sources, it does not actively market its services to individuals, businesses, or local governments (Kodrzycki and Elmatad, 2011).
BND has a diversified loan portfolio, of which the largest shares are student loans (37%) and commercial loans (36%). Roughly 50% of the bank’s loan portfolio consists of loan participations and loan purchases from community banks. Loan participations are arrangements where a lead bank (in this case, a smaller institution) originates and services a loan, and another bank (in this case, BND) is involved in some capacity. This involvement can take various forms, including guarantees, capital contributions for the initial loan, and interest rate buy-downs (contributions to payments during the early years of a loan, to reduce costs to the borrower). Some 50% of BND’s loan portfolio is guaranteed by federal and state agencies. As mentioned, the only major area where BND actively competes with other banks is student loans (Kodrzycki and Elmatad, 2011).
During the past 35 years, the bank has returned roughly two-thirds of its profits to the state, on average. However, this share has been quite variable, ranging from a low of near zero in 1989 and 2000 to more than 150% in 1996 and 2001 (Kodrzycki and Elmatad, 2011).17
The North Dakota banking market has a robust small bank presence. Banks with less than $500 million in deposits account for almost one-half of total bank deposits in the state (Kodrzycki and Elmatad, 2011). In 2014, North Dakota had 11.2 banks per 100,000 residents.18 The figure for Tennessee is 3.12 as of 2022,19 while the U.S. average for 2021 is 1.27.20
In this environment, BND plays the role of sharing risk with smaller banks, ensuring that larger-scale projects can get funding. Smaller banks and the state government tend to turn to BND for funding during crises (Kodrzycki and Elmatad, 2011).21
According to S&P Global, as of November 2021, BND had a credit rating of A+. To quote the report:
b) History of paper credit and banking in North America
The Thirteen Colonies of England, later to become the United Colonies and then the United States, only struck a limited amount of silver coins. Instead, the silver coins from Spanish Mexico began to circulate widely. Spain was from 1516 to 1713 ruled by the Austrian Habsburg dynasty. In one of the Habsburg core territories, in the Iron Mountain area of Bohemia, a major silver mine near the small town of Joachimstal delivered the material used to strike silver coins with a high precious-metal content. The coins came to be called “Joachimstaler,” after the town, which came to be shortened to “Taler.” In the local German dialect this was pronounced “Dolar,” which is also what they came to be known as in North America.
Given the limited amount of silver or gold coins available in the colonies, Francis Rawle, a Quaker merchant and landowner in the Pennsylvania Assembly, wrote a document in 1721, in which he proposed the issuance of paper money by the State of Pennsylvania that would not be backed by gold or silver.
On March 12, 1723, the Assembly passed the first enabling act, permitting the issuance of £15,000 of bills of credit with £4000 to support the government and £11,000 for loans on land, houses, farms, and businesses: “AN ACT FOR THE EMITTING AND MAKING CURRENT FIFTEEN THOUSAND POUNDS IN BILLS OF CREDIT.” The State of Pennsylvania also created a General Loan Office of Pennsylvania with powers to negotiate loans, ascertain the value of securities, receive mortgage payment, and sell, grant, or dispose of mortgaged property in default of payment.
The scheme was highly successful. By March 12, 1724, there were £45,000s in circulation. During the Seven Years War, the colonies were forced to support Britain and issued large amounts of paper currency. After the war, paper currency was actively taken out of circulation in order to check inflation. A net sum of 25,000 was retired from 1760 to 1769, while prices dropped by ca. 13%.
Always jealous of economic success of ordinary people in the colonies, on April 19, 1764, the British Parliament passed the Currency Act of 1764, prohibiting the colonies from printing any new paper money (Lester, 1938). This had a devastating impact on the economy of the colonies, and the protests that followed are said to have contributed to the momentum that culminated in the War of Independence.
It is only with the end of the issuance of state paper money that, a few years later, the first bank in U.S. history was granted a charter by Congress, the Bank of North America in 1782. This was followed by the first two state-run institutions, The Massachusetts Bank and the Bank of New York in 1784. When George Washington became president in 1789, these were the only three banks in the U.S. (Sylla, 2019).
In 1791, the first attempt at establishing a central bank was made by private sector entrepreneurs. It was called “The First Bank of the United States” and granted a 20-year charter by the United States Congress. In the following five years, 18 new commercial banks sprang into existence. The charter expired in 1811.
In the early 1800s, during the beginning of the Industrial Revolution, the emergence of a new class of merchants and manufacturers produced the need for more capital across the U.S. At this time, being a developing country, European banks refused to lend to the U.S. Government, thus creating the need for a domestic supply of credit.
“The Second Bank of the United States” was granted a twenty-year charter in 1816. As the renewal date approached, in 1833, U.S. President Andrew Jackson made the decision to remove U.S. Treasury deposits from the Second Bank of the United States. Instead he placed them in a number of state banks. Three years later when the time came to renew the charter for The Second Bank of the United States, President Jackson vetoed the bill leading the bank to convert into a private corporation. This was the beginning of the “free banking” era, a time when only state-chartered banks existed. This lasted until 1862. After this came the era of both state and nationally chartered banks.
The total number of banks in the US peaked in ca. 1926 at ca. 23,000 banks. The Federal Reserve policies of the 1920s and 1930s had created a vast expansion of bank credit for asset purchases, causing the asset bubble of the “Roaring Twenties,” while the subsequent tightening of bank credit and the closure of more than 10,000 banks resulted in a significant contraction of bank credit and hence economic growth and prices—the deflationary Great Depression.
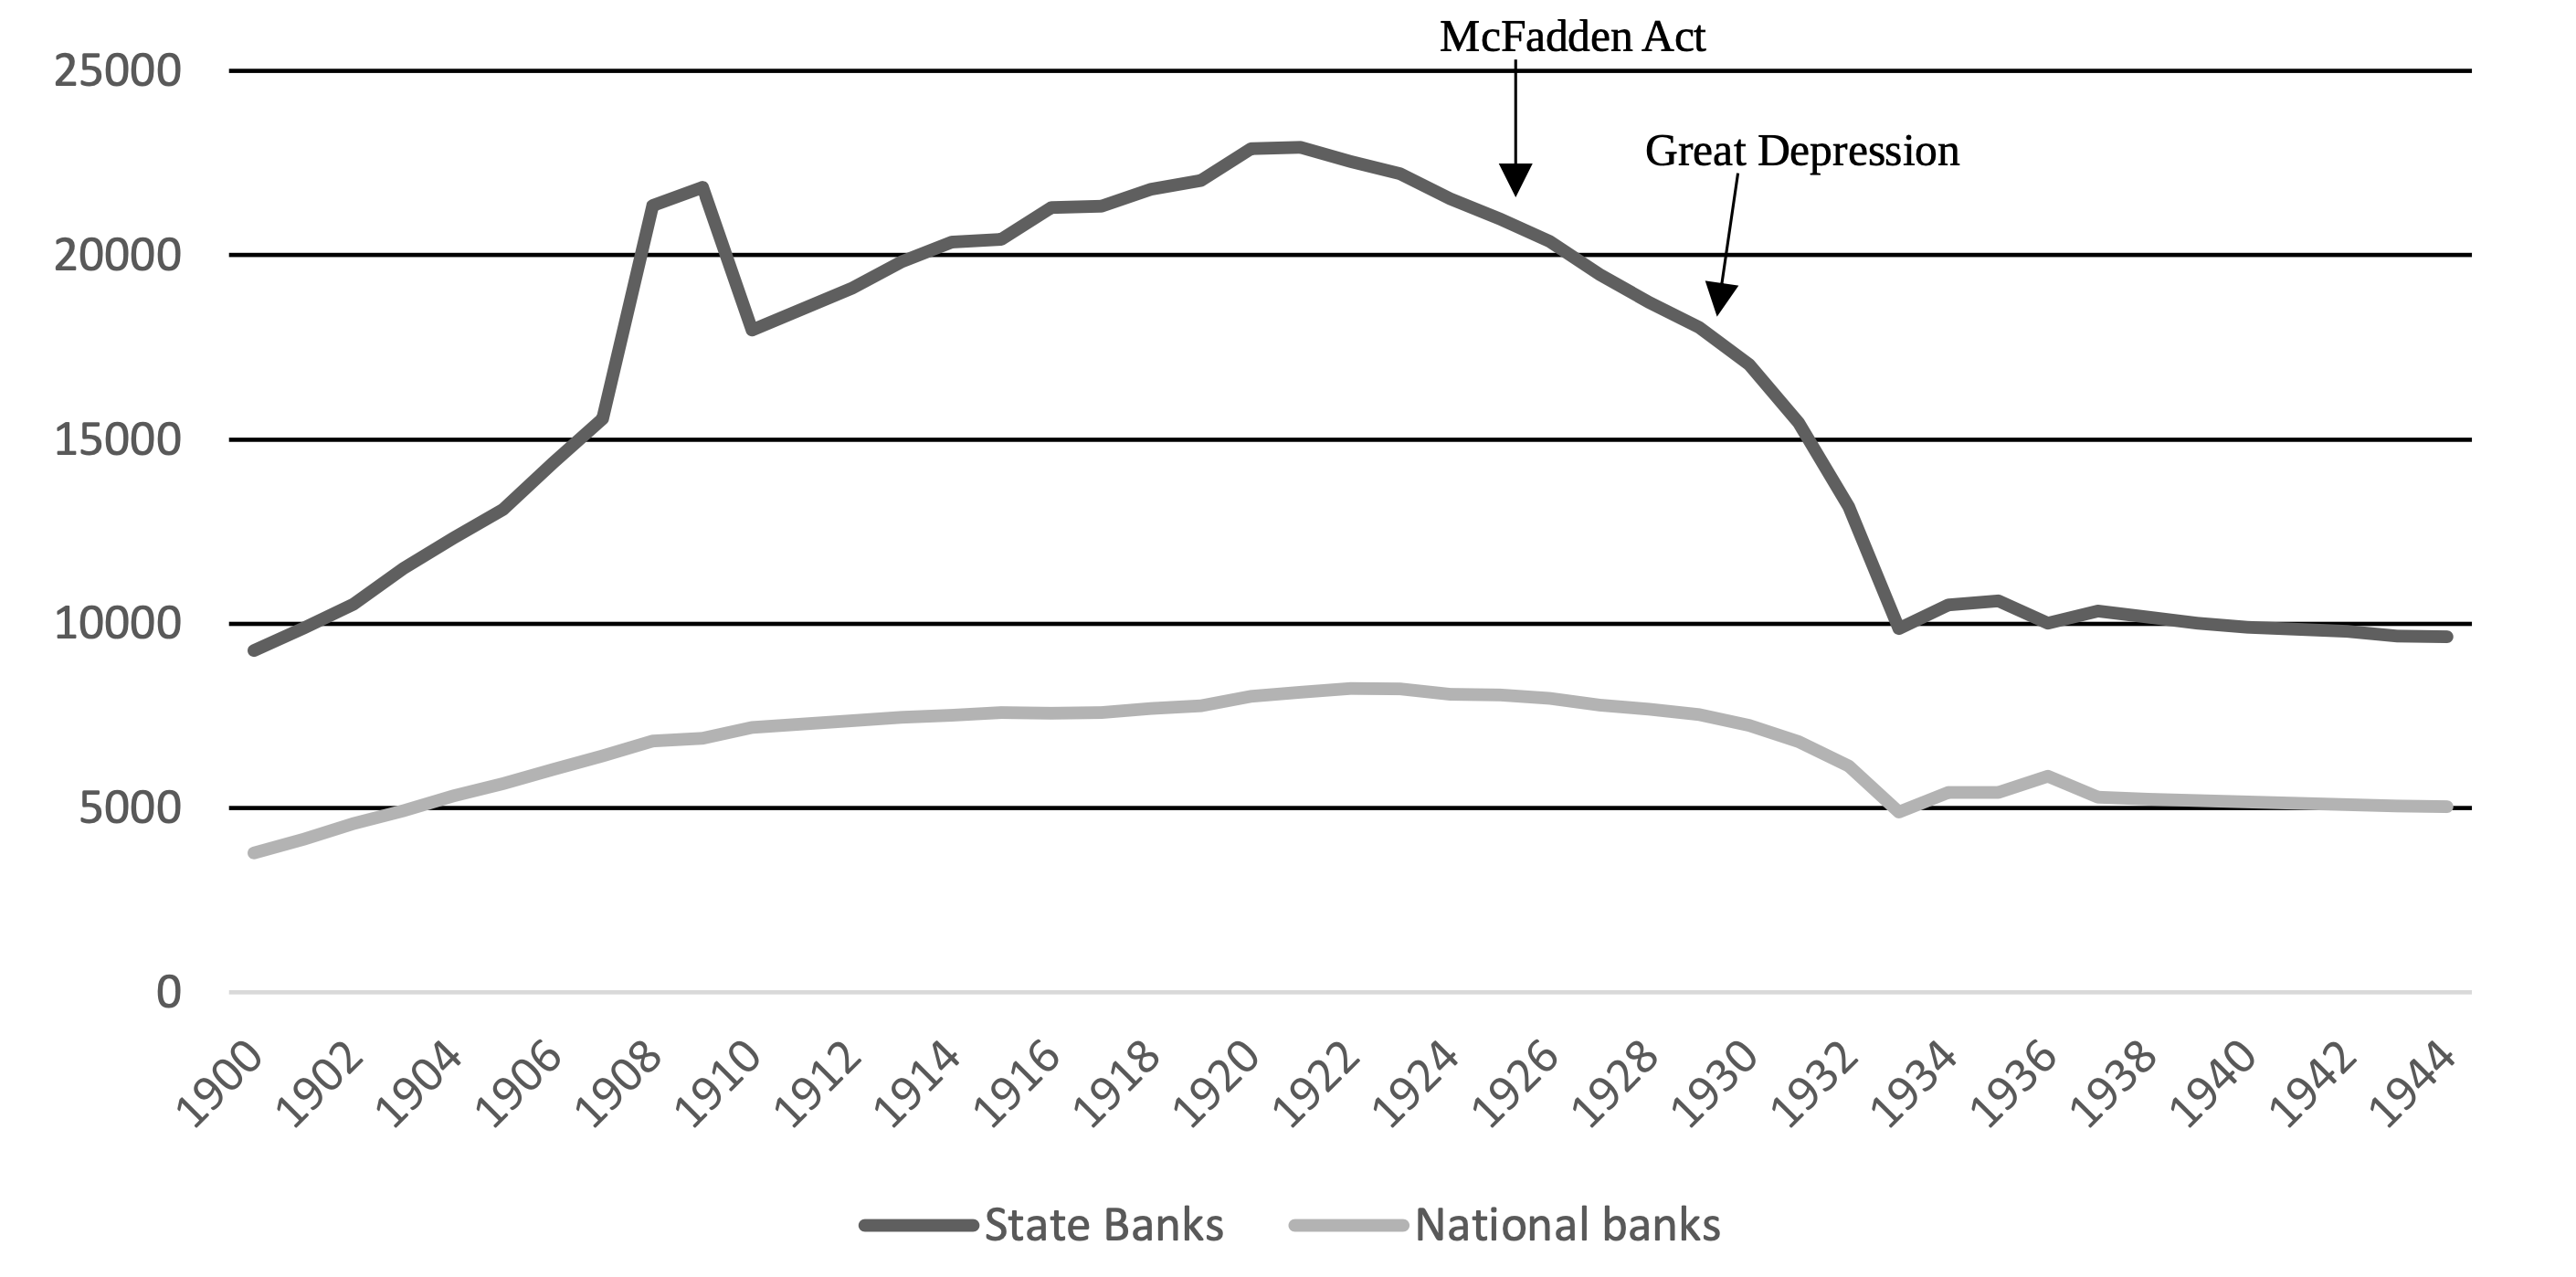
The establishment of the FDIC as a government corporation in 1933 through “The Banking Act” gave the FDIC authority for supervision over state non-member banks, leading to the subsequent examination of around 8,000 statewide banks which were not members of the Federal Reserve System. This act extended federal oversight over all commercial banks and the Glass-Steagall Act in the same year separated commercial and investment banking.
By 1934, after only one year, the FDIC had an office located in every state and introduced deposit insurance of $2,500 per qualified account increasing to $5,000 later in that year. By 1935, there were 9,027 state-level banks, compared to 4,692 nationally chartered banks. According to the FDIC, this approximate number of banks remained consistent until the 1980s.
Concerning the question of state-owned banks, by the year 1900, Virginia and Kentucky were the only states remaining with state-owned banks. Today the only state bank across the U.S. is the Bank of North Dakota.
-
Alabama, Kentucky, Illinois, Vermont, Georgia, Tennessee, and South Carolina all established banks which were owned, in their entirety, by the state government.
-
Missouri, Indiana, and Virginia had banks with the state holding a majority interest.
-
By 1900, only Virginia and Kentucky survived.
-
In 1919, the Bank of North Dakota was founded, as banks outside of North Dakota charged farmers in North Dakota extortionate interest rates of up to 12%.
-
Today, the only state bank remaining is the Bank of North Dakota.
c) Other historical examples
Many German states established state-level, state-owned banks in the 19th century.
d) Domestic, including recent legislation
Recent legislation to allow for the establishment of state-level or public banks is listed below (list compiled by the Solari Report):
2023:
Massachusetts – An Act to establish a Massachusetts public bank. There shall be a Massachusetts public bank (the Bank), wholly owned by the commonwealth, to provide a safe depository for a portion of the public funds in the commonwealth and to support the economic well-being of the commonwealth, its cities and towns, its residents, its businesses and its state and municipal institutions, with an accountable and responsive governance structure that ensures community input. (sources: HD.2677 (https://malegislature.gov/Bills/193/HD2677) and SD.1589 (https://malegislature.gov/Bills/193/SD1589))
New York – Establishes the state of New York public bank. Relates to establishing the state of New York public bank to use the state’s depository assets to generate additional benefit for the people and the economy of the state. (sources: A2536 (https://www.nysenate.gov/legislation/bills/2023/A2536) and S1756 (https://www.nysenate.gov/legislation/bills/2023/s1756))
Oregon – Establishes State Public Bank Task Force. Directs task force to study and make recommendations regarding establishment of state public bank. Requires task force to submit report to committee of Legislative Assembly by January 31, 2024. (sources: HB 2763 (https://olis.oregonlegislature.gov/liz/2023R1/Downloads/MeasureDocument/HB2763/Introduced))
Oregon – Establishes Bank of the State of Oregon. Specifies purposes of bank. Establishes Bank of the State of Oregon Board to operate and manage bank. Creates advisory board of directors to advise bank board and management on operation of bank. Requires bank to accept deposits of public funds and permits bank to accept deposits of other funds. Permits bank to make, purchase, guarantee or hold certain loans and to serve as custodian bank. Specifies other powers. Directs State Treasurer to deposit moneys in bank in amount treasurer determines is necessary to allow bank to fulfill duties. (source: SB 501 (https://olis.oregonlegislature.gov/liz/2023R1/Downloads/MeasureDocument/SB0501/Introduced))
Washington – Creating the Washington state public infrastructure bank.
(source: SB 5509 (https://app.leg.wa.gov/billsummary?BillNumber=5509&Year=2023&Initiative=false))
2022:
Oregon – Proposes amendment to Oregon Constitution to specify that section restricting certain banks does not prohibit establishment of bank owned or operated by State of Oregon. Refers proposed amendment to people for their approval or rejection at next regular general election.
(source: HJR 205 (https://olis.oregonlegislature.gov/liz/2022R1/Downloads/MeasureDocument/HJR205))
New Mexico – Public Banking Act (source: HB 75 (https://www.nmlegis.gov/Legislation/Legislation?Chamber=H&LegType=B&LegNo=75&year=22))
New York – Establishes the state of New York public bank. Relates to establishing the empire state public bank to use the state’s depository assets to generate additional benefit for the people and the economy of the state. (source: A 8857 (https://www.nysenate.gov/legislation/bills/2021/A8857))
2021:
Massachusetts – An Act to establish a Massachusetts public bank. (sources: S665 (https://malegislature.gov/Bills/192/SD1712) and H122 (https://malegislature.gov/Bills/192/HD3247))
New Mexico – An Act Relating to Public Finance; Enacting the Public Banking Act; Creating the Public Bank of New Mexico. (sources: SB 313 (https://www.nmlegis.gov/Sessions/21%20Regular/bills/senate/SB0313.pdf) and HB 236 (https://nmlegis.gov/Sessions/21%20Regular/bills/house/HB0236.pdf))
Hawaii – A Bill for an Act Relating to a Bank of the State of Hawaii; Bank of the State of Hawaii Working Group; Establishes the bank of the State of Hawaii working group to propose legislation to establish a state-operated bank of the State of Hawaii. Appropriates funds. The working group shall submit a report of its findings and recommendations, including any proposed legislation, to the legislature by January 1, 2022. Effective 7/1/2050. (source: HB 240 HD1 (https://www.capitol.hawaii.gov/sessions/session2021/bills/HB240_HD1_.PDF))
Hawaii – A Bill for an Act Relating to Public Banking; Implementation Board; State-Owned Bank; Financial Institutions; Establishes an implementation board to review, investigate, and study the feasibility of establishing a state-owned bank. Requires a report to the legislature prior to the regular session of 2022. (source: HB 1103 (https://www.capitol.hawaii.gov/sessions/session2021/Bills/HB1103_.pdf))
New York – Relates to establishing the state of New York public bank to use the state’s depository assets to generate additional benefit for the people and the economy of the state. (source: S 1055 (https://www.nysenate.gov/legislation/bills/2021/s1055))
New York – Relates to establishing the empire state public bank to use the state’s depository assets to generate additional benefit for the people and the economy of the state. (source: A 3309 (https://www.nysenate.gov/legislation/bills/2021/A3309))
New York – Relates to establishing the New York Public Banking Act. This bill would establish the New York Public Banking Act to create a safe and appropriate regulatory framework for cities and counties seeking to establish public banks. The bill additionally would allow the Department of Financial Services (DFS) to issue special-purpose public bank charters. (sources: S 1762 (https://www.nysenate.gov/legislation/bills/2021/S1762) and A 5782
(https://www.nysenate.gov/legislation/bills/2021/A5782))
Oregon – Establishes Bank of the State of Oregon. (source: SB 399 (https://olis.oregonlegislature.gov/liz/2021R1/Downloads/MeasureDocument/SB339/Introduced))
Oregon – Provides that local government may not become stockholder in or loan credit to or in aid of municipal bank. Provides that municipal bank is not required to obtain deposit insurance from Federal Deposit Insurance Corporation under certain conditions. Provides that municipal bank may act as depository or custodian of public funds under certain conditions. This bill has been introduced at the request of the Oregon Public Bank Alliance. (source: HB 2743 (https://olis.oregonlegislature.gov/liz/2021R1/Measures/Overview/HB2743))
Washington – Concerning the creation of the Washington state public bank. (source: SB 5188 (https://apps.leg.wa.gov/billsummary?BillNumber=5188&Initiative=false&Year=2021))
States that introduced legislation prior to 2021
Alaska
Arizona
California
Colorado
Connecticut
DC
Hawaii
Idaho
Illinois
Louisiana
Maine
Maryland
Massachusetts
Michigan
Minnesota
Mississippi
Missouri
Montana
Nevada
New Hampshire
New Jersey
New Mexico
New York
North Carolina
North Dakota
Oregon
Pennsylvania
Rhode Island
South Carolina
Vermont
Virginia
Washington
West Virginia
e) International
A comprehensive overview of state banks is beyond the scope of this report. Instead, a few key examples are highlighted.
Germany:
On the national level, the Kreditanstalt für Wiederaufbau (KfW) has served as the de facto economic development bank of the state. Founded in 1948 to help with the rebuilding of cities that had been carpet-bombed during the Second World War, today it is the world’s largest development bank and has a balance sheet of more than $550 billion. More than 90% of its funding needs are raised by the issuance of bonds that are guaranteed by the Federal Republic of Germany and hence obtain a high credit rating, lowering the funding costs. At the same time, KfW is exempted from corporate taxes due to its legal status as a public agency. It provides loans for purposes prescribed by the KfW Law at lower rates than commercial banks. However, it does not compete directly with banks and funnels most of its lending to the final borrowers via the private sector banking system. The German banking system has the largest number of banks in Europe, of which 80% (almost 1,500) are not-for-profit local community banks (public savings banks or mutually owned cooperative banks). Thus the role of KfW is similar to the role the State Bank of Tennessee could play on the state level in the U.S.
Another relevant example are the state-level banks. The Federal Republic of Germany consists of 16 states, several of which also have their own state-owned banks. An example is the Landeskreditbank Baden-Württemberg in South-West Germany. This state bank has had the task to provide development loans to companies and housing loans to individuals, as well as cooperate with the local banks. In 2021 it recorded assets of $90 billion.
United Kingdom:
The German KfW state bank was examined by leading politicians and lawmakers in the UK (e.g. Sir Vince Cable as Secretary of State for Business, Innovation and Skills) and was taken as a model for the establishment of the British Business Bank, established by Sir Vince Cable in 2014. This is a UK state bank, with a similar goal to KfW, namely to ensure sufficient funding for SMEs and the economy in general and help the functioning of the financial sector.
However, unlike the KfW in Germany, which can rely on more than 1,500 community banks to funnel its funding to SMEs, in the UK there are virtually no community banks. As a result, the British Business Bank has relied more on fund-based investment schemes, outsourcing individual investments to fund management companies earning attractive fees. This has raised the cost for the end user. Furthermore, the British Business Bank remains a small institution, recording a balance sheet of only $4.2 billion at the end of 2022, with a capital of ca. $3 billion. The lacking ingredient in the UK is that (a) the British Business Bank, despite its name, does not operate as a bank, but rather as an investment fund, as can be seen from its capital/asset ratio; and (b) local and community banks, which do not yet exist.
Japan:
A key example is the Development Bank of Japan, which was founded in 1951 as the Japan Development Bank. It had $162 billion in assets in 2022, with a capital of $7.6 billion. This bank has provided loans to companies directly, but more commonly, similarly to KfW in Germany, in syndication with other banks.
India and China:
These developing countries have utilized numerous state banks and state-owned banking enterprises to boost economic growth. Most Chinese banks have a significant state ownership. China presently has the second largest number of banks in the world, at more than 4,000, after the United States of America (more than 5,000).
VIII. The Case for Growth and Prosperity
For centuries, it was thought that for an economy to grow, the amount of money in circulation ought to increase proportionally. This was the famous “quantity theory of money,” also called the “equation of exchange.” This equation linked together the “real economy” (Y) (what we today call real Gross Domestic Product, or GDP), the price level (P), with the amount of money (M), which circulated with certain velocity (V).
P × Y = M × V
For a while, this relationship worked well empirically, and the data seemed to suggest the equation was valid, which meant that velocity V was relatively constant, and the link between money M and the real economy Y was understood: more money, more economic activity.
In the 1970s, however, the equation began to break down, and velocity V no longer seemed stable; it actually fell substantially during the 1970s through the 1980s across industrialized countries. As Charles Goodhart, a prominent UK monetary economist put it:
“The equation came apart at the seams during the course of the 1980s” (Goodhart, 1989).
In other words, the link between money and the economy was no longer a reliable one. The economics profession reacted by capitulation, and dropped money altogether from virtually all economic models (the infamous DSGE models that did not see the crisis coming).
During the 1990s, a series of papers by Werner (1992, 1997) appeared that showed that the equation wrongly assumed that all money is used for real economy transactions, as measured by GDP. This was evidently not the case.
Werner performed two operations to the quantity equation:
-
Replace money (M) by bank credit (C).
-
Divide the money stream into two: money that goes into the real economy (CR), like loans for SMEs, and money that goes into speculation and unproductive uses (CF), like real estate and investment funds.
The replacement of money (M) by bank credit (C) can be done because, as several central banks and dozens of economists now recognize, banks create money when they grant loans. The Bank of England, for example, explains in a 2014 paper that:
“When banks make loans they create additional deposits for those that have borrowed … Banks making loans and consumers repaying them are the most significant ways in which bank deposits are created and destroyed in the modern economy” (Bank of England, 2014).
More recently, the Bundesbank stated that:
“In fact, book money is created as a result of an accounting entry: when a bank grants a loan, it posts the associated credit entry for the customer as a sight deposit by the latter and therefore as a liability on the liability side of its own balance sheet. This refutes a popular misconception that banks act simply as intermediaries” (Bundesbank, 2017).
According to the UK’s most prominent monetary economist, Charles Goodhart, this new view “is now taking over as the consensus approach” (Goodhart, 2017).
In a landmark empirical test, Werner (2014a) cooperated with a German community bank in lower Bavaria, the Raiffeisenbank Wildenberg e.G. to test which of the three theories of banking (the financial intermediation theory, the fractional reserve theory, or the credit creation theory) was correct. The test consisted in borrowing €200,000 from the bank and recording all the internal transactions that the bank registered in its IT accounting system. The test showed without doubt that the bank created the money when it extended the loan. No money was transferred from other accounts inside or outside the bank. The money was created “out of nothing.”
In other words, unlike non-bank firms, banks create money when they lend to households, firms, and governments. They do so by crediting the borrower’s account, as a simple double-entry book-keeping exercise. The next figure shows the structural difference between bank and non-bank lending mechanics.
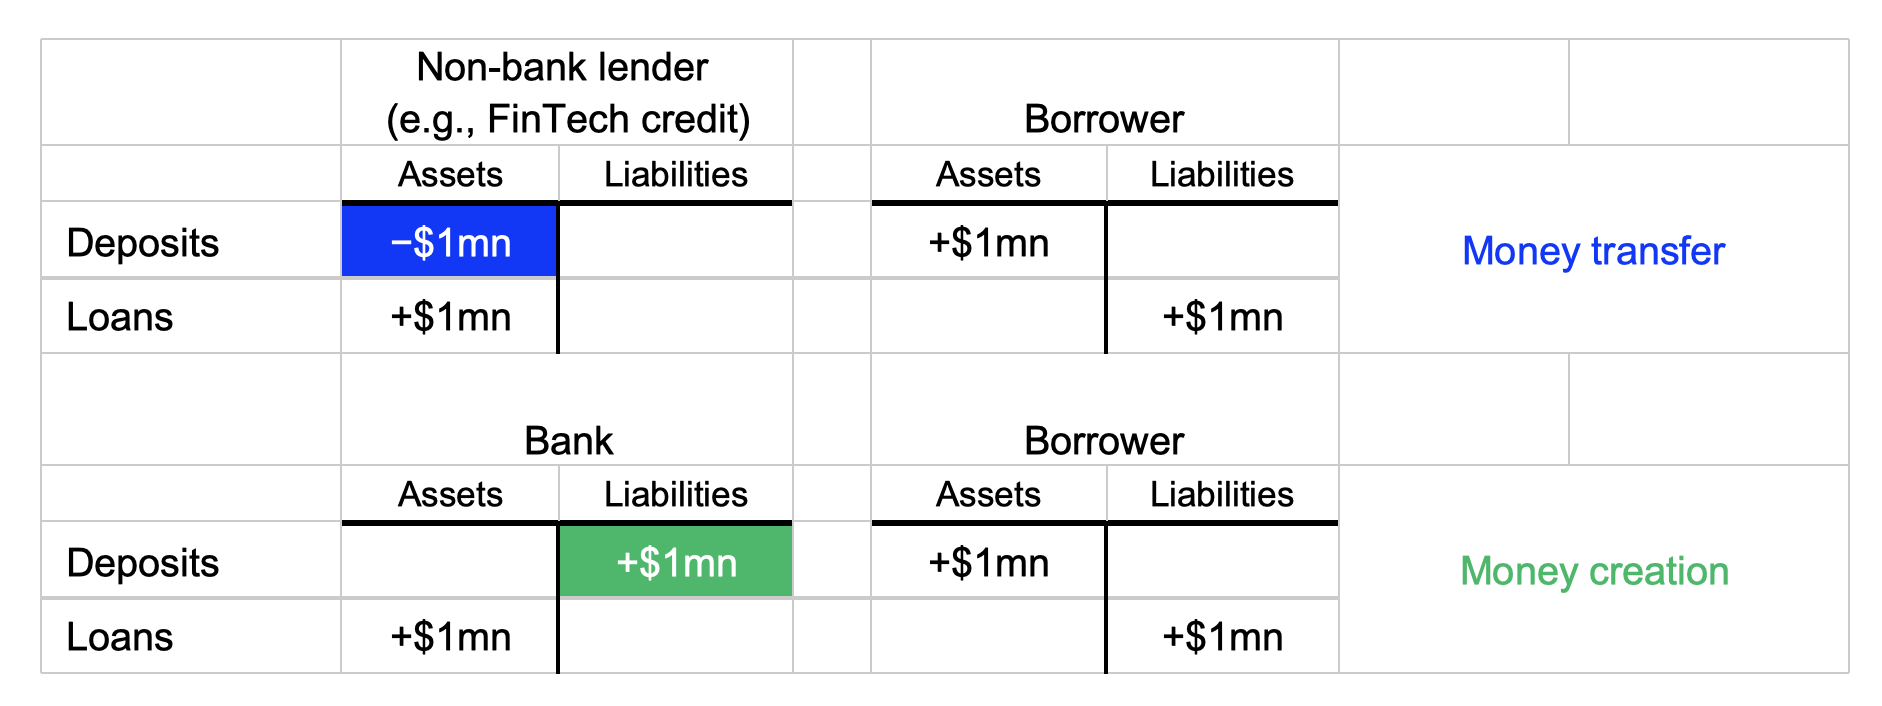
Mechanics of lending by non-banks (top) and banks (bottom).
Thus, the quantity theory of money can be turned into two separate equations:
CV = CRVR + CFVF
PQ = PRQR + PFQF
The next step was to equate the first pair of variables and the second pair of variables, so that:
CRVR = PRQR = PRY
With VR = PRY / CR constant
And:
CFVF = PFQF = PFA
With VF = PFA / CF constant
Applying the chain rule for differences (that is, Δ(ab) = aΔb + bΔa. With a constant, Δ(ab) = aΔb) which, when applied to stocks, represent flows:
ΔPRY = ΔnGDP = ΔCRVR
ΔPFA = ΔCFbVF
Finally, using year-over-year relative growth rates:
ΔnGDP / nGDP = ΔCR/CR (1)
ΔPFA / PFA = ΔCF/CF (2)
The quantity theory of money turned into a new theory: the quantity theory of disaggregated credit (QTDC). It has two predictions:
-
Equation (1): The economy grows if bank lending for the real economy grows.
-
Equation (2): Asset bubbles are caused by non-productive bank lending.
Since it was formulated in the 1990s by Werner, other scholars have put the theory to test with successful results.22 Virtually all of the papers found that bank lending to the real economy, measured in various ways, was the only statistically significant variable explaining nominal GDP growth.
The next figure shows estimates by Werner (1997) for the Japanese economy during the 1980s and 1990s. The left panel shows the first prediction of the theory, namely, that nominal GDP growth ought to be caused by bank credit for GDP transactions. The right panel shows the second prediction: Asset bubbles (in this case, land prices) are caused by bank credit to real estate.
The econometric tests performed by Werner confirmed the predictions, but we can see by visual inspection that the theory is very plausible. The two graphs below use Japanese (top) and American (bottom) data.23
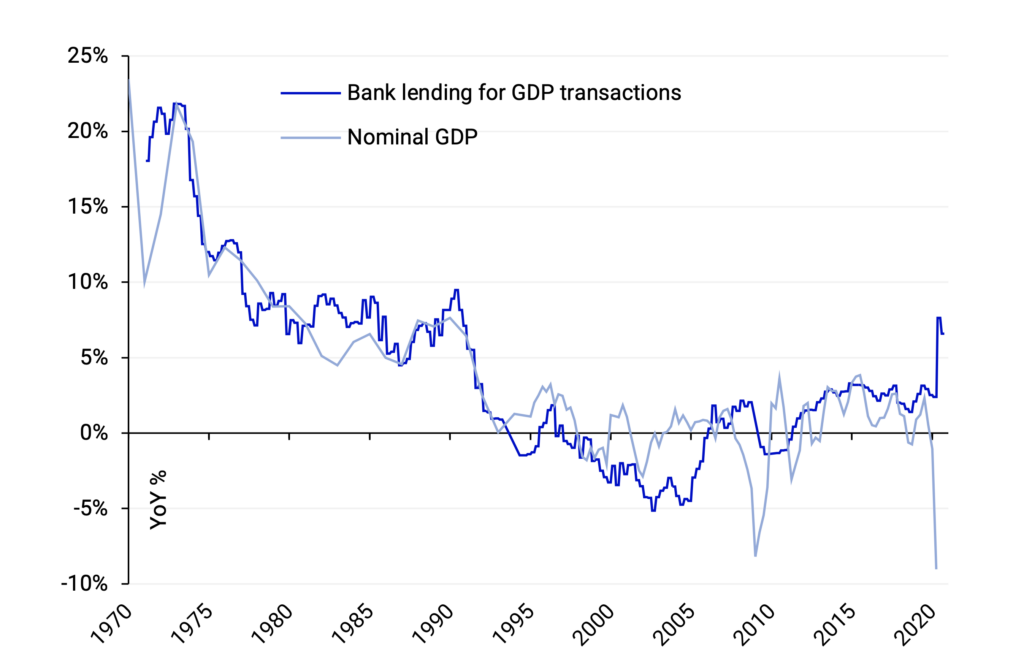
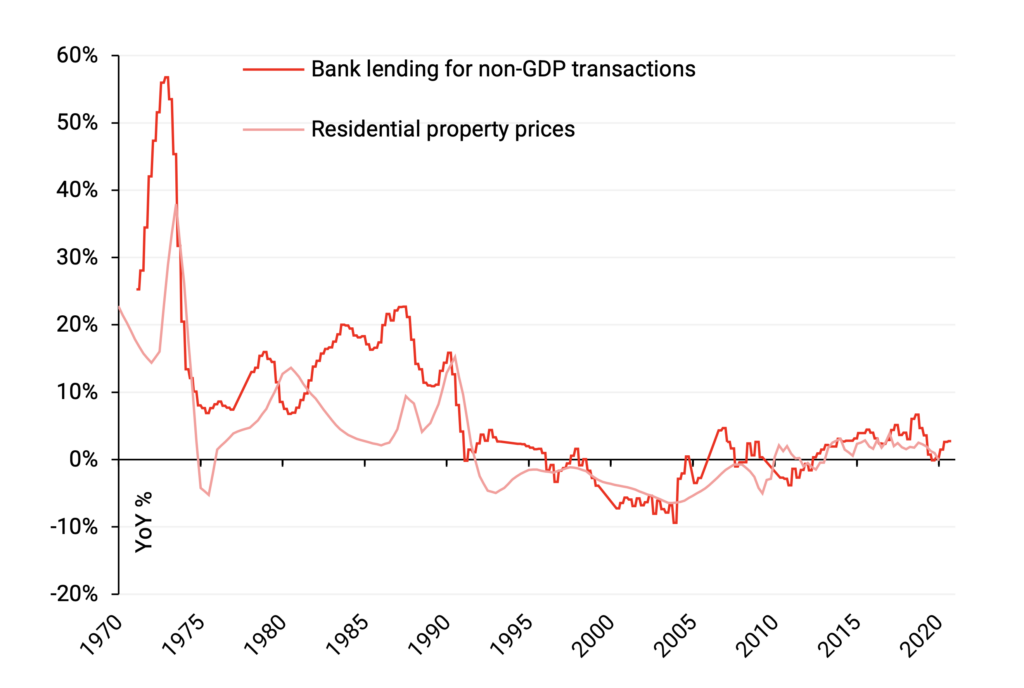
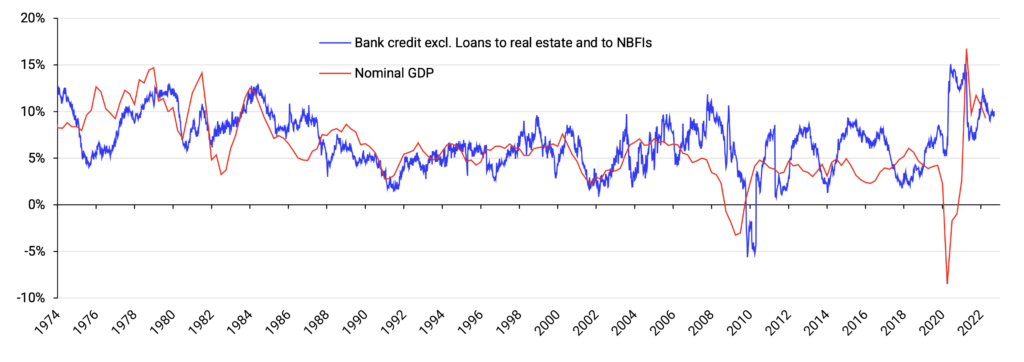
Top: Bank lending in Japan. Sources: Werner (1997); Bank of Japan. Bottom, in blue: Growth of total U.S. commercial bank credit excluding loans to real estate and loans to non-bank financial institutions. Bottom, in red: U.S. nominal GDP growth. Source: Board of Governors of the Federal Reserve, H.8 Assets and Liabilities of Commercial Banks in the United States.
In the area of banking and macroeconomics, Richard Werner’s quantity theory of credit stands as the empirically most successful theory. The theory has far-reaching implications:
a) The economy can only grow if banks lend for activities that contribute to GDP
This includes lending to firms which will invest (I) in machinery, R&D, staff training, acquisition of fixed assets, etc.; lending to governments (G) who will spend in paying civil servants and infrastructure projects, and lending to households for consumption (C). GDP can also be stimulated when banks lend to successful exporters.
GDP = C + I + G + NX
b) Asset bubbles can be prevented
This can be done by redirecting bank lending away from mortgages and lending to other financial institutions, to lending to non-financial firms.
c) Only lending to the real economy is sustainable
For every dollar in new debt created by bank loans to the real economy, there is a one-dollar increase in national income (GDP). Therefore, the debt is sustainable and can be serviced and repaid. GDP grows in tandem with debt, and debt-to-GDP levels stay constant.24
Bank lending to non-GDP activities, on the other hand, increases debt but does not increase GDP. It leads to ever higher debt-to-GDP ratios which create crises, recessions, and debt overhangs that stifle growth. They also decrease house affordability and increase inequality through capital gains.
d) Lending for consumption can create inflation — lending for investment is less inflationary
If more money chases a fixed amount of goods and services, it is more likely that this will result in inflation than if lending is directed at investment (machinery, equipment, R&D, etc.), which will expand the productive capacity of the economy and thus increase demand as well as supply of goods and services.
e) Small banks can have big effects
Unlike non-bank financial intermediaries like investment funds, bank lending creates money, and if fed adequately to the economy (through GDP expenditures), it can make whole communities and regions grow in a sustainable way.
Furthermore, SMEs are the biggest employer in most countries, and they are the backbone of any economy. As mentioned, a dramatic case in point is provided by German SMEs: well-served by the thousands of small, not-for-profit community banks, these SMEs can access funding to grow. In fact, during the 2008-2009 recession, unlike the big German banks, the small banks increased lending to their SME customers when they most needed it. Germany has the highest number of “hidden champions,” more than any other country in the world. These firms are world leaders in their niche markets in terms of market share, and they contribute substantially to Germany’s 8%-odd trade surplus.
IX. Setting Up the State Bank of Tennessee
The fastest way to establish the State Bank of Tennessee and ensure an immediate and significant impact, while allowing it to fulfill its function virtually from launch, is for the SBT to be established with sufficient capital to allow it to purchase 20% of the bank loans of all local and community banks in Tennessee. This would allow the community banks to immediately expand their lending by replacing the sold-off loans with new lending.
According to FDIC data, Tennessee’s 99 community banks (defined as those with total deposits <$1 billion and with >50% of their deposits booked in Tennessee) have a combined balance sheet of $32.7 billion.25
For SBT to be able to purchase at least 20% worth of these banks’ loans (or $6.7 billion), SBT would need to have a balance sheet of at least $10 billion. Assuming a leverage ratio of 5%, and without considering retained profits or set-up costs, this translates into an initial capitalization by the State of Tennessee of $500 million.26
According to the National Association of State Budget Officers (NASBO), Tennessee’s total expenditures in fiscal year (FY) 2021 were $46.4 billion, including general funds, other state funds, bonds, and federal funds.27 That is, setting up SBT would cost 1.07% of the State’s annual expenditure.
This cost would be a one-off expense, as SBT would henceforth be able to be fully self-funded, by growing its capital from retained earnings and raising funding for its lending from bond issuance, as well as accepting deposits of all state funds (like in North Dakota) and deposits from Tennessee banks. For comparison, the development banks in Germany and Japan are solely funded from bond issuance.
SBT would be debt-funded through a mix of deposits from community banks and the Tennessee State Government, as well as bonds issued.28 On the asset side, SBT would hold loans and/or bonds issued by the TSG, loans purchased from Tennessee community banks, and loan participations with Tennessee community banks.
The balance sheet mechanics are shown below.
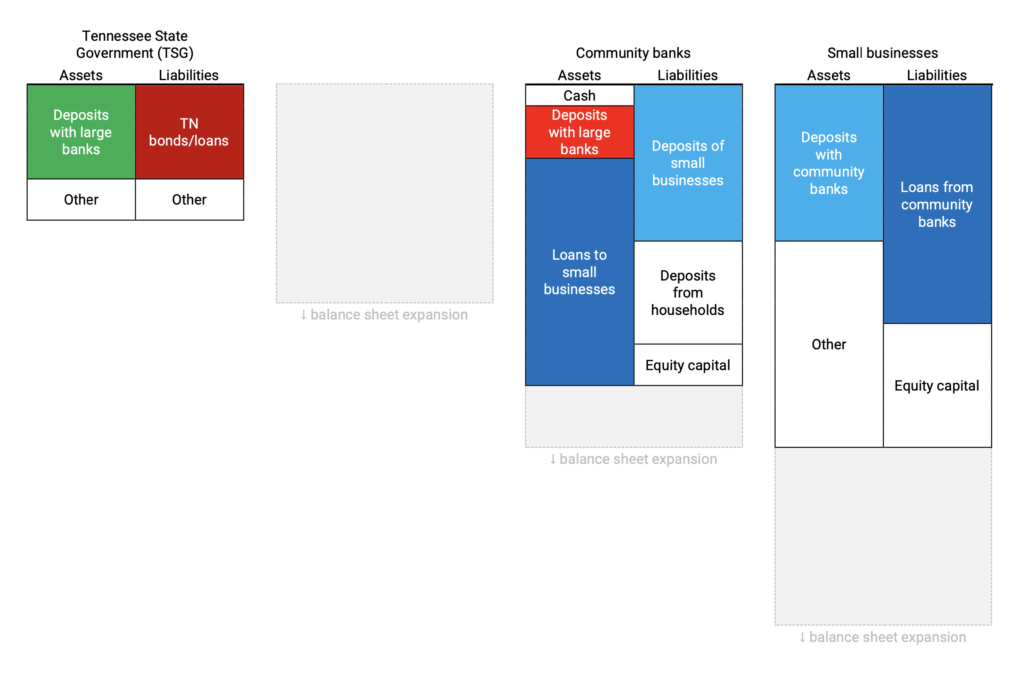
Balance sheet structure before the introduction of SBT.
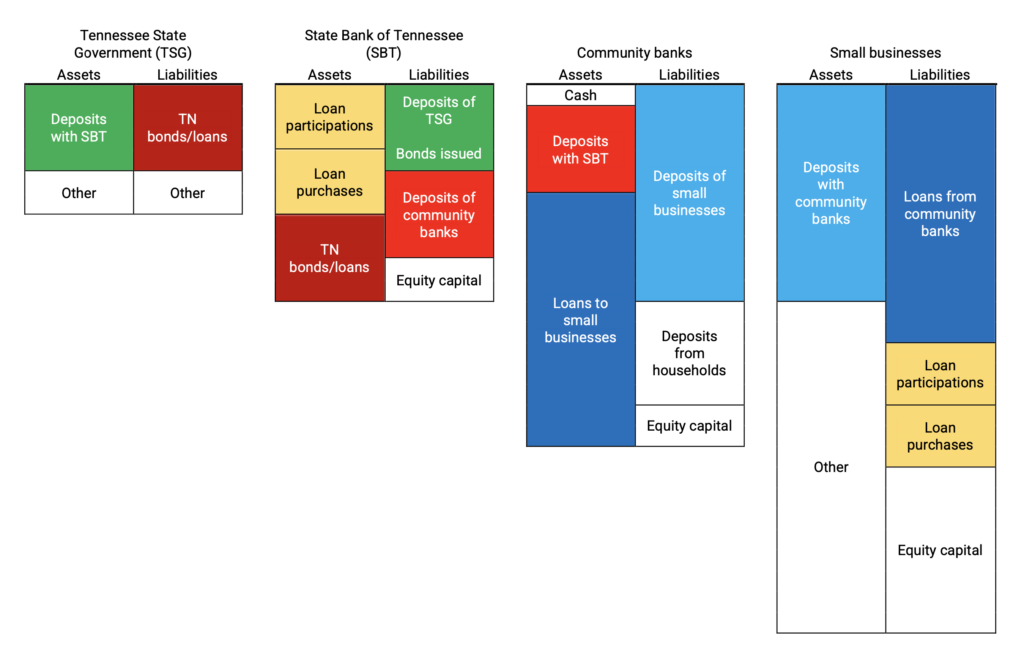
Balance sheet structure after the introduction of SBT. TSG would place deposits with SBT, and so would community banks. SBT would use this funding to buy TSG bonds/bonds, loan participations and loans from community banks. Community banks would use the additional “balance sheet space” to provide more loans to small businesses. In practice, the purchase of the loans from the community banks is “paid” by SBT by simply crediting the banks in their accounts with the SBT, thus creating their deposits at SBT. The community banks will also be able to use their SBT accounts for settlement between them.
X. Conclusion
It is usually beneficial for the owners to create a new bank. This also applies to a State Bank of Tennessee.
Historically, the North American colonies were pioneers in modern monetary systems, as the colonial state governments introduced paper money in order to ensure monetary independence from oppressive outside forces. The very success of the colonial “scrip” money resulted in its suppression by the British government under King George III. The suppression of its successful monetary system was one of the contributing factors leading to the War of Independence.
Once again, the states in North America can act in a far-sighted and pioneering manner by establishing state-owned banks, similar to the currently only such bank, the Bank of North Dakota.
Key features of such a bank include its structure and mission, namely not to work against the existing commercial and community banks, but act as a hub bank that is supportive of them, similarly to the Federal Reserve Bank of New York acting toward the banks in Manhattan that are its owners. A state bank in Tennessee would have many and significant benefits (as listed in Section V), including that it would act to insulate the economy of the State of Tennessee from contagion threatened by external financial instability.
The United States has thrived whenever credit creation for productive business investment has expanded. One mechanism to achieve this was the creation of tens of thousands of banks in the U.S. During the era of growing bank numbers, economic growth was high, job creation abounded, and there was general prosperity. However, for the past 30 years, Federal Reserve policies have acted to reduce the number of local banks and credit unions. With the decline in the number of banks, economic growth has trended down.
The establishment of the State Bank of Tennessee would act to halt the steady decline in the number of banks in the U.S. This, in turn, would reverse the decline in the potential economic growth rate.
The establishment of a state bank is also a crucial step to counter the ambitions of central planning bureaucracies located inside the major central banks, which is to further increase their already vast powers and political independence via the creation of central bank digital currency.
It is recommended that the State Bank of Tennessee include the mission to establish and operate a state-level bullion depository, while avoiding a membership with the FDIC in order to maximize its independence from federal agencies.
Banking is one of the most profitable industries. The State Bank of Tennessee will be profitable and constitutes a sound investment for the State of Tennessee. However, the benefits abound and go beyond merely commercial attractiveness. The establishment of the State Bank of Tennessee is a crucial step that can be built upon in a variety of ways in order to be able to counter future possible threats to financial and economic stability and economic and political autonomy and freedoms.
Bio: Richard Werner
Professor Richard A. Werner, MA, D.Phil. (Oxon), is a London School of Economics and Oxford-educated economist, university professor of banking and economics at the University of Winchester, England, authorized investment adviser and economic adviser to governments. Previously he was professor of international banking at the University of Southampton, professor of banking and finance at De Montfort University, Leicester, England; professor of monetary economics at Goethe-University Frankfurt, Germany; professor of finance at Fudan University, Shanghai, China; assistant professor of economics at Sophia University, Tokyo, Japan; and visiting professor at numerous universities.
Professor Werner has over 30 years of professional experience in the financial sector. He was the first Shimomura Fellow at the Development Bank of Japan in Tokyo in 1991, and chief economist of Jardine Fleming Securities (Asia) Ltd. in Tokyo since 1993. In this role he became top-ranked Japan economist in the industry’s Greenwich survey and a top-3 economist in the Institutional Investor Survey. In 1995 he proposed a new policy to end banking crises which he called “Quantitative Easing.” His book Princes of the Yen, on central banking, was a top bestseller in Japan in 2001. The 2003 English edition warned of the coming credit bubbles, banking crises, and recessions. Some of his academic research is among the most downloaded scientific work in the world (see www.professorwerner.org).
Between 1998 and 2004, Richard advised numerous institutional and government clients, including U.S. state pension funds (State of New Jersey, Texas Teachers), financial institutions, the Asian Development Bank, the Japanese Ministry of Finance, the Thai government, and parliamentarians in a number of countries. His corporate experience includes years as member of the Asset Allocation Committee of TelWel, a $6.2bn Japanese corporate pension fund, as Senior Managing Director and Senior Portfolio Manager at Bear Stearns Asset Management Ltd. managing the Bear Stearns Global Alpha Fund in London, as director of a Paris-based large company and chair of the audit committee of a London Stock Exchange-listed international corporation with more than 5000 staff. From 2010 to 2020, he was a member of the ECB Shadow Council, and since 2010 has been involved in planning and establishing community banks in the UK via the not-for-profit social enterprise without shareholders Local First Community Interest Company.
Contact: werner@local-first.org.uk
Tel. +44 77 1785 5478
Bibliography and Links
Adams, R.M., and J.P. Gramlich (2014), ‘Where are all the new banks? The role of regulatory burden in new charter creation’. https://www.federalreserve.gov/econresdata/feds/2014/files/2014113pap.pdf
Bank of England (2014), ‘Money creation in the modern economy’. By McLeay, M., A. Radia, and R. Thomas, Bank of England Quarterly Bulletin 2014 Q1
BND (2021), 2021 Annual Report, Bank of North Dakota, https://bnd.nd.gov/pdf/2021_bnd_annual_report.pdf
Board of Governors of the Federal Reserve (2022), Availability of Credit to Small Businesses, https://www.federalreserve.gov/publications/files/sbfreport2022.pdf
Borsuk, M., O. Kowalewski, and P. Pisani (2022), ‘State-owned banks and international shock transmission’. ECB Working Paper Series, No. 2662, May 2022, https://www.ecb.europa.eu/pub/pdf/scpwps/ecb.wp2661~5a47947b05.en.pdf
Brennecke, C., S. Jacewitz, and J. Pogach (2020), ‘Shared Destinies? Small Banks and Small Business Consolidation’. FDIC Working Paper Series, FDIC CFR WP 2020-04, Shared Destinies? Small Banks and Small Business Consolidation (fdic.gov)
Brown, D. (2019), ‘Spotlight on community bank lending’. https://cdn.advocacy.sba.gov/wp-content/uploads/2019/09/25164013/Fact-Sheet-Community-Bank-Lending.pdf
Bundesbank (2017), ‘The role of banks, non-banks and the central bank in the money creation process’, Deutsche Bundesbank Monthly Report April 2017
Collins, L. (2018), ‘The Bank of North Dakota: Reliable financing for the common good’, https://www.shareable.net/the-bank-of-north-dakota-reliable-financing-for-the-common-good/
Council of Economic Advisers (2016), ‘The performance of community banks over time’, August 2016, https://obamawhitehouse.archives.gov/sites/default/files/page/files/20160810_cea_community_banks.pdf
CRS (2018), ‘Introduction to Bank Regulation: Credit Unions and Community Banks: A Comparison’. Congressional Research Service, December 14, 2018, https://sgp.fas.org/crs/misc/IF11048.pdf
CSBS (2022), National Survey of Community Banks, https://www.csbs.org/system/files?file=2022-09/CB22pub_2022_survey_Final_n092122.pdf
FDIC (2018), FDIC Small business lending survey, https://www.fdic.gov/bank/historical/sbls/full-survey.pdf
Fohlin, C., and M. Jaremski (2015), ‘Bank Concentration in the United States, 1800-1914’, https://www.aeaweb.org/conference/2016/retrieve.php?pdfid=14014&tk=YTtQE235
García, A., Lands, B., Liu, X. and Slive, J. (2020), ‘The potential effect of a central bank digital currency on deposit funding in Canada’, Bank of Canada Staff Analytical Note 2020-15, https://www.bankofcanada.ca/2020/07/staff-analytical-note-2020-15/
Goodhart, C.A.E (1989), Money, Information and Uncertainty, 2nd ed., The MIT Press
Goodhart, C.A.E. (2017), ‘The determination of the money supply: Flexibility versus control’. Proceedings of the Money, Macroeconomics and Finance Research Group, 2016, Vol. 85, Issue S1, pp. 33-56, September 2017
Havermann, Al. (2022). Financial processes of the Pennsylvania Colony 1721-1764. Mimeo
Jagtiani, J., and R.Q. Maingi (2019), ‘How important are local community banks to small business lending? Evidence from mergers and acquisitions’. Federal Reserve Bank of Philadelphia Working Papers, WP-18-18, https://www.philadelphiafed.org/-/media/frbp/assets/working-papers/2018/wp18-18.pdf
Kodrzycki, Y.K., and T. Elmatad (2011), ‘The Bank of North Dakota: A model for Massachusetts and other states?’. New England Public Policy Center, Research Report 11-2, May 2011, https://www.bostonfed.org/-/media/Documents/Workingpapers/PDF/neppcrr1102.pdf
Main, K. (2022), ‘Small business statistics of 2023’, https://www.forbes.com/advisor/business/small-business-statistics/#sources_section
McCord, R., E.S. Prescott, and T. Sablik (2015), ‘Explaining the Decline in the Number of Banks since the Great Recession’. EB15-03 – Federal Reserve Bank of Richmond, https://www.richmondfed.org/-/media/richmondfedorg/publications/research/economic_brief/2015/pdf/eb_15-03.pdf
Mkhaiber A., and R.A. Werner (2021), “Funding of small firms: Are big banks less helpful and has the crisis changed this?”. ScienceDirect, https://www.sciencedirect.com/science/article/pii/S0261560620302370
Panizza, U. (2022), ‘State-owned commercial banks’. Journal of Economic Policy Reform, DOI: 10.1080/17487870.2022.2076678
S&P Global (2021), RatingsDirect: Bank of North Dakota, https://bnd.nd.gov/pdf/sp_report_2021.pdf
Weber, W.E. (2006), ‘Early state banks in the United States: How many were there and when did they exist?’ Federal Reserve Bank of Minneapolis Quarterly Review, September 2006, https://www.minneapolisfed.org/research/working-papers/early-state-banks-in-the-united-states-how-many-were-there-and-when-did-they-exist
Werner, R.A. (1997), ‘Towards a new monetary paradigm: A quantity theorem of disaggregated credit, with evidence from Japan’, Kredit und Kapital, Duncker and Humblot, Berlin, Vol. 30, no. 2, July, pp. 276−309
Werner, R.A. (2014a), ‘Can banks individually create money out of nothing? — The theories and the empirical evidence’. International Review of Financial Analysis 36 (2014) 1–19
Werner, Richard A. (2014b). How do banks create money, and why can other firms not do the same? An explanation for the coexistence of lending and deposit-taking, International Review of Financial Analysis, 36, 71-77
http://www.sciencedirect.com/science/article/pii/S1057521914001434 https://doi.org/10.1016/j.irfa.2014.10.013
Werner, Richard A. (2014c). Enhanced debt management: Solving the eurozone crisis by linking debt management with fiscal and monetary policy, Journal of International Money and Finance, 49, 443-469, http://www.sciencedirect.com/science/article/pii/S0261560614001132 https://doi.org/10.1016/j.jimonfin.2014.06.007
Zhou, L. (2023), ‘Small business statistics: The ultimate list in 2023’. https://www.luisazhou.com/blog/small-business-statistics/
Appendices
Appendix A: New Bank Charters in Tennessee, 2000-2020
| Tennessee Commerce Bank | Franklin | TN | 01/10/2000 |
| Morgan Trust Company, FSB | Memphis | TN | 03/02/2000 |
| First Central Bank of Monroe | Sweetwater | TN | 05/08/2000 |
| Academy Bank | Lebanon | TN | 08/25/2000 |
| Insurors Bank of Tennessee | Nashville | TN | 09/01/2000 |
| Pinnacle National Bank | Nashville | TN | 09/26/2000 |
| Peoples Bank of Bedford County | Shelbyville | TN | 10/23/2000 |
| Traditions First Bank | Erin | TN | 11/09/2000 |
| Cumberland Bank & Trust | Clarksville | TN | 12/11/2000 |
| Community Bank of the Cumberlands | Jamestown | TN | 01/12/2001 |
| Bank of the South | Mount Juliet | TN | 04/20/2001 |
| Bank of Greeneville | Greeneville | TN | 06/14/2001 |
| PrimeTrust Bank | Nashville | TN | 11/16/2001 |
| Southeast Bank and Trust | Athens | TN | 03/12/2002 |
| Bank of Lincoln County | Fayetteville | TN | 07/11/2002 |
| Patriot Bank | Millington | TN | 09/23/2002 |
| First Commerce Bank | Lewisburg | TN | 11/12/2002 |
| Community National Bank of the Lakeway Area | Morristown | TN | 11/15/2002 |
| First Source Bank | Germantown | TN | 04/17/2003 |
| Homeland Community Bank | McMinnville | TN | 10/23/2003 |
| Heritage Community Bank | Greeneville | TN | 11/14/2003 |
| American Security Bank and Trust Company | Hendersonville | TN | 12/24/2003 |
| MidSouth Bank | Murfreesboro | TN | 01/13/2004 |
| American Trust Bank of East Tennessee | Lenoir City | TN | 01/16/2004 |
| Independence Trust Company | Franklin | TN | 03/09/2004 |
| CedarStone Bank | Lebanon | TN | 03/26/2004 |
| Nashville Bank and Trust Company | Nashville | TN | 08/18/2004 |
| Cohutta Banking Company of Tennessee | Chattanooga | TN | 10/22/2004 |
| Franklin County United Bank | Decherd | TN | 11/15/2004 |
| Paragon National Bank | Memphis | TN | 11/15/2004 |
| Sumner Bank & Trust | Gallatin | TN | 03/01/2005 |
| Civic Bank & Trust | Nashville | TN | 06/30/2005 |
| Putnam 1st Mercantile Bank | Cookeville | TN | 10/26/2005 |
| Bank of Tullahoma (The) | Tullahoma | TN | 10/27/2005 |
| Vision Bank | Tullahoma | TN | 11/07/2005 |
| Reliant Bank | Brentwood | TN | 11/18/2005 |
| Heritage Bank & Trust | Columbia | TN | 01/25/2006 |
| First Freedom Bank | Lebanon | TN | 03/16/2006 |
| Triumph Bank | Germantown | TN | 05/11/2006 |
| Commerce Union Bank | Springfield | TN | 06/14/2006 |
| SmartBank | Pigeon Forge | TN | 11/29/2006 |
| TriSummit Bank | Kingsport | TN | 12/12/2006 |
| CapitalMark Bank & Trust | Chattanooga | TN | 02/02/2007 |
| Foothills Bank & Trust | Maryville | TN | 04/24/2007 |
| Franklin Synergy Bank | Franklin | TN | 10/31/2007 |
| CapStar Bank | Nashville | TN | 07/08/2008 |
| Tennessee Bank & Trust | Nashville | TN | 06/28/2017 |
| Studio Bank | Nashville | TN | 06/06/2018 |
| RockPoint Bank, N.A. | Chattanooga | TN | 04/24/2020 |
Number of new bank charters in Tennessee (TN) since 2000. Source: FDIC.
Appendix B: Deposit Market Shares for Tennessee
| Outside of market | Inside of market | ||||||
| Institution Name | State (Hqrtd) | Charter | No. of offices | Deposits ($000) | No. of offices | Deposits ($000) | Market share |
| First Horizon Bank | TN | State | 298 | 40,383,143 | 146 | 31,494,241 | 14.18% |
| Regions Bank | AL | State | 1,094 | 114,607,269 | 200 | 24,955,731 | 11.23% |
| Pinnacle Bank | TN | State | 72 | 9,397,713 | 52 | 23,363,958 | 10.52% |
| Truist Bank | NC | State | 2,010 | 416,522,700 | 108 | 18,920,300 | 8.52% |
| Bank of America, National Association | NC | Federal | 3,849 | 1,945,479,867 | 56 | 18,560,993 | 8.35% |
| FirstBank | TN | State | 13 | 1,038,106 | 79 | 9,514,552 | 4.28% |
| U.S. Bank National Association | OH | Federal | 2,184 | 450,183,813 | 68 | 5,127,364 | 2.31% |
| Simmons Bank | AR | State | 195 | 18,535,015 | 46 | 3,707,388 | 1.67% |
| Wilson Bank and Trust | TN | State | 0 | 0 | 29 | 3,706,897 | 1.67% |
| Fifth Third Bank, National Association | OH | Federal | 1,050 | 163,222,410 | 40 | 3,354,548 | 1.51% |
| SmartBank | TN | State | 16 | 1,173,605 | 24 | 3,115,902 | 1.40% |
| United Community Bank | SC | State | 156 | 18,410,720 | 32 | 2,761,323 | 1.24% |
| Capstar Bank | TN | State | 0 | 0 | 23 | 2,640,533 | 1.19% |
| Wells Fargo Bank, National Association | SD | Federal | 4,746 | 1,439,502,541 | 20 | 2,531,459 | 1.14% |
| Cadence Bank | MS | State | 381 | 37,907,692 | 31 | 2,286,788 | 1.03% |
| Home Federal Bank of Tennessee | TN | Federal | 0 | 0 | 23 | 2,285,197 | 1.03% |
| Southeast Bank | TN | State | 0 | 0 | 14 | 2,052,032 | 0.92% |
| First Citizens National Bank | TN | Federal | 0 | 0 | 25 | 2,025,562 | 0.91% |
| First Farmers and Merchants Bank | TN | State | 0 | 0 | 22 | 1,880,698 | 0.85% |
| Renasant Bank | MS | State | 140 | 12,208,667 | 17 | 1,711,970 | 0.77% |
| Bank of Tennessee | TN | State | 1 | 51,071 | 22 | 1,552,496 | 0.70% |
| Citizens National Bank | TN | Federal | 0 | 0 | 24 | 1,513,102 | 0.68% |
| One Bank of Tennessee | TN | State | 0 | 0 | 19 | 1,372,582 | 0.62% |
| Citizens Bank of Lafayette | TN | State | 0 | 0 | 22 | 1,330,199 | 0.60% |
| F&M Bank | TN | State | 1 | 12,627 | 21 | 1,322,538 | 0.60% |
| Mountain Commerce Bank | TN | State | 0 | 0 | 6 | 1,221,402 | 0.55% |
| First National Bank of Tennessee | TN | Federal | 0 | 0 | 7 | 1,172,457 | 0.53% |
| Citizens Tri-County Bank | TN | State | 0 | 0 | 25 | 1,121,392 | 0.50% |
| Independent Bank | TN | State | 0 | 0 | 9 | 1,082,026 | 0.49% |
| Commercial Bank & Trust Co. | TN | State | 0 | 0 | 10 | 1,047,102 | 0.47% |
| First Volunteer Bank | TN | State | 3 | 252,350 | 21 | 1,020,556 | 0.46% |
| City National Bank | CA | Federal | 74 | 78,792,253 | 1 | 969,468 | 0.44% |
| Tennessee State Bank | TN | State | 0 | 0 | 16 | 962,191 | 0.43% |
| Volunteer State Bank | TN | State | 0 | 0 | 13 | 946,522 | 0.43% |
| Citizens Bank | TN | State | 0 | 0 | 13 | 921,506 | 0.41% |
| Commercial Bank | TN | State | 14 | 515,298 | 18 | 892,777 | 0.40% |
| First Federal Bank | TN | State | 0 | 0 | 17 | 874,658 | 0.39% |
| Apex Bank | TN | State | 0 | 0 | 18 | 808,842 | 0.36% |
| Truxton Trust Company | TN | State | 0 | 0 | 1 | 793,365 | 0.36% |
| Legends Bank | TN | State | 0 | 0 | 9 | 755,564 | 0.34% |
| The Farmers Bank | TN | State | 0 | 0 | 9 | 754,671 | 0.34% |
| The Bank of Fayette County | TN | State | 0 | 0 | 12 | 753,550 | 0.34% |
| First National Bank of Pulaski | TN | Federal | 4 | 351,915 | 8 | 748,497 | 0.34% |
| Trustmark National Bank | MS | Federal | 172 | 14,103,804 | 15 | 741,524 | 0.33% |
| Security Bank and Trust Company | TN | State | 1 | 51,163 | 10 | 731,797 | 0.33% |
| Studio Bank | TN | State | 0 | 0 | 1 | 689,600 | 0.31% |
| Synovus Bank | GA | State | 253 | 48,846,459 | 8 | 688,531 | 0.31% |
| The First National Bank of Middle Tennessee | TN | Federal | 0 | 0 | 10 | 675,748 | 0.30% |
| Hometrust Bank | NC | State | 27 | 2,446,797 | 7 | 660,715 | 0.30% |
| Citizens Bank | TN | State | 0 | 0 | 7 | 651,180 | 0.29% |
| Centennial Bank | TN | State | 0 | 0 | 13 | 604,532 | 0.27% |
| Financial Federal Bank | TN | State | 0 | 0 | 1 | 590,691 | 0.27% |
| INSBANK | TN | State | 0 | 0 | 2 | 566,361 | 0.25% |
| First Freedom Bank | TN | State | 0 | 0 | 6 | 558,823 | 0.25% |
| JPMorgan Chase Bank, National Association | OH | Federal | 4,804 | 2,127,909,621 | 14 | 552,379 | 0.25% |
| The Hardin County Bank | TN | State | 0 | 0 | 5 | 544,452 | 0.25% |
| First Community Bank of Tennessee | TN | State | 0 | 0 | 5 | 539,427 | 0.24% |
| Macon Bank and Trust Company | TN | State | 0 | 0 | 8 | 532,070 | 0.24% |
| SimplyBank | TN | State | 3 | 127,627 | 9 | 530,835 | 0.24% |
| First Commerce Bank | TN | State | 0 | 0 | 5 | 495,290 | 0.22% |
| CB&S Bank, Inc. | AL | State | 38 | 1,697,528 | 16 | 493,703 | 0.22% |
| First Century Bank | TN | State | 0 | 0 | 9 | 491,187 | 0.22% |
| Andrew Johnson Bank | TN | State | 0 | 0 | 8 | 481,524 | 0.22% |
| BankTennessee | TN | State | 0 | 0 | 9 | 478,049 | 0.22% |
| Paragon Bank | TN | State | 3 | 15,743 | 4 | 462,182 | 0.21% |
| Bank of Bartlett | TN | State | 0 | 0 | 7 | 447,400 | 0.20% |
| CBBC Bank | TN | State | 0 | 0 | 7 | 437,322 | 0.20% |
| INSOUTH Bank | TN | State | 0 | 0 | 6 | 428,303 | 0.19% |
| ServisFirst Bank | AL | State | 22 | 11,370,090 | 1 | 416,185 | 0.19% |
| Tristar Bank | TN | State | 0 | 0 | 6 | 408,650 | 0.18% |
| Patriot Bank | TN | State | 0 | 0 | 8 | 408,483 | 0.18% |
| Fourth Capital Bank | TN | State | 0 | 0 | 4 | 406,471 | 0.18% |
| Bank of Frankewing | TN | State | 1 | 19,045 | 3 | 382,007 | 0.17% |
| The First Bank and Trust Company | VA | State | 20 | 2,219,620 | 6 | 377,538 | 0.17% |
| Carroll Bank and Trust | TN | State | 0 | 0 | 8 | 377,233 | 0.17% |
| Bank3 | TN | State | 1 | 4,676 | 5 | 375,108 | 0.17% |
| Southern Bank of Tennessee | TN | State | 0 | 0 | 4 | 357,325 | 0.16% |
| Wayne County Bank | TN | State | 0 | 0 | 6 | 350,509 | 0.16% |
| Planters Bank, Inc. | KY | State | 9 | 848,070 | 4 | 333,332 | 0.15% |
| First Vision Bank of Tennessee | TN | State | 0 | 0 | 4 | 331,277 | 0.15% |
| Peoples Bank of East Tennessee | TN | State | 1 | 28,289 | 9 | 312,707 | 0.14% |
| Thread Bank | TN | State | 0 | 0 | 2 | 309,753 | 0.14% |
| Bank of Cleveland | TN | State | 0 | 0 | 5 | 296,306 | 0.13% |
| The First National Bank of Oneida | TN | Federal | 0 | 0 | 4 | 286,761 | 0.13% |
| Volunteer Federal Savings Bank | TN | State | 0 | 0 | 6 | 283,777 | 0.13% |
| Planters Bank & Trust Company | MS | State | 19 | 1,338,034 | 1 | 279,738 | 0.13% |
| Bank of Dickson | TN | State | 0 | 0 | 4 | 276,884 | 0.12% |
| First National Bank | AR | Federal | 20 | 1,629,344 | 3 | 272,427 | 0.12% |
| Security Federal Savings Bank of McMinnville | TN | State | 0 | 0 | 3 | 268,983 | 0.12% |
| Citizens Community Bank | TN | State | 0 | 0 | 3 | 268,293 | 0.12% |
| Tower Community Bank | TN | State | 1 | 662 | 9 | 267,040 | 0.12% |
| Citizens Bank and Trust Company of Grainger County | TN | State | 0 | 0 | 5 | 257,025 | 0.12% |
| Bank of Ripley | TN | State | 0 | 0 | 4 | 256,230 | 0.12% |
| Peoples Bank | TN | State | 0 | 0 | 3 | 254,138 | 0.11% |
| Coffee County Bank | TN | State | 0 | 0 | 4 | 253,117 | 0.11% |
| TNBANK | TN | State | 0 | 0 | 5 | 251,173 | 0.11% |
| Newport Federal Bank | TN | Federal | 0 | 0 | 3 | 248,036 | 0.11% |
| First Financial Bank, National Association | IN | Federal | 71 | 4,195,857 | 7 | 247,066 | 0.11% |
| Heritage Bank & Trust | TN | State | 0 | 0 | 3 | 240,502 | 0.11% |
| Homeland Community Bank | TN | State | 0 | 0 | 4 | 237,868 | 0.11% |
| Millennium Bank | TN | State | 4 | 254,455 | 6 | 232,140 | 0.10% |
| Union Bank | TN | State | 0 | 0 | 3 | 223,414 | 0.10% |
| Cedarstone Bank | TN | State | 0 | 0 | 3 | 221,118 | 0.10% |
| First-Citizens Bank & Trust Company | NC | State | 580 | 89,214,267 | 6 | 219,328 | 0.10% |
| The Bank of Jackson | TN | State | 0 | 0 | 3 | 217,661 | 0.10% |
| Bank of Crockett | TN | State | 0 | 0 | 5 | 216,221 | 0.10% |
| Traditions First Bank | TN | State | 0 | 0 | 3 | 213,960 | 0.10% |
| Security Bank | TN | State | 0 | 0 | 7 | 211,014 | 0.09% |
| Community Bank | TN | State | 0 | 0 | 4 | 208,482 | 0.09% |
| Community Trust Bank, Inc. | KY | State | 75 | 4,276,730 | 3 | 206,268 | 0.09% |
| Sumner Bank & Trust | TN | State | 0 | 0 | 3 | 200,539 | 0.09% |
| Decatur County Bank | TN | State | 0 | 0 | 4 | 196,385 | 0.09% |
| First Peoples Bank of Tennessee | TN | State | 0 | 0 | 5 | 194,898 | 0.09% |
| Elizabethton Federal Savings Bank | TN | Federal | 0 | 0 | 5 | 194,672 | 0.09% |
| First Farmers & Commercial Bank | TN | State | 0 | 0 | 3 | 186,163 | 0.08% |
| First Community Bank of East Tennessee | TN | State | 0 | 0 | 5 | 183,235 | 0.08% |
| Bank of Perry County | TN | State | 0 | 0 | 3 | 182,757 | 0.08% |
| Farmers State Bank | TN | State | 0 | 0 | 3 | 182,497 | 0.08% |
| Peoples Bank of The South | TN | State | 0 | 0 | 3 | 172,434 | 0.08% |
| McKenzie Banking Company | TN | State | 0 | 0 | 8 | 171,176 | 0.08% |
| Bank of Lincoln County | TN | State | 0 | 0 | 3 | 165,924 | 0.07% |
| Peoples Bank of Middle Tennessee | TN | State | 0 | 0 | 1 | 161,015 | 0.07% |
| Guaranty Bank and Trust Company | MS | State | 22 | 1,300,131 | 4 | 158,375 | 0.07% |
| United Cumberland Bank | KY | State | 4 | 176,257 | 3 | 150,021 | 0.07% |
| People’s Bank and Trust Company of Pickett County | TN | State | 1 | 44,995 | 1 | 147,675 | 0.07% |
| Lineage Bank | TN | State | 0 | 0 | 3 | 141,817 | 0.06% |
| Hearthside Bank Corporation | KY | State | 3 | 264,105 | 3 | 141,043 | 0.06% |
| Mountain Valley Bank | TN | State | 0 | 0 | 4 | 139,399 | 0.06% |
| Putnam 1st Mercantile Bank | TN | State | 0 | 0 | 3 | 138,533 | 0.06% |
| Peoples Bank & Trust Company | TN | State | 0 | 0 | 1 | 136,552 | 0.06% |
| Greeneville Federal Bank, FSB | TN | Federal | 0 | 0 | 3 | 132,590 | 0.06% |
| Johnson County Bank | TN | State | 0 | 0 | 1 | 126,408 | 0.06% |
| Heritage Community Bank | TN | State | 0 | 0 | 3 | 121,324 | 0.05% |
| Citizens Savings Bank and Trust Company | TN | State | 0 | 0 | 2 | 120,489 | 0.05% |
| Central Bank | TN | State | 0 | 0 | 3 | 119,822 | 0.05% |
| Home Banking Company | TN | State | 1 | 8,425 | 4 | 114,692 | 0.05% |
| Rockpoint Bank, National Association | TN | Federal | 0 | 0 | 1 | 108,436 | 0.05% |
| The Peoples Bank | TN | State | 0 | 0 | 5 | 106,212 | 0.05% |
| Bank of Gleason | TN | State | 0 | 0 | 2 | 103,825 | 0.05% |
| Bank of Halls | TN | State | 0 | 0 | 2 | 102,236 | 0.05% |
| UBank | TN | State | 0 | 0 | 2 | 99,905 | 0.04% |
| Union Bank & Trust Company | TN | State | 0 | 0 | 1 | 95,520 | 0.04% |
| Liberty Bank and Trust Company | LA | State | 18 | 811,273 | 1 | 95,399 | 0.04% |
| The Bank of Milan | TN | State | 0 | 0 | 2 | 92,513 | 0.04% |
| First Community Bank of The Heartland, Inc. | KY | State | 6 | 252,102 | 5 | 85,756 | 0.04% |
| Greenfield Banking Company | TN | State | 0 | 0 | 1 | 84,735 | 0.04% |
| First Community Bank | VA | State | 54 | 2,726,188 | 2 | 81,635 | 0.04% |
| Republic Bank & Trust Company | KY | State | 40 | 4,782,007 | 2 | 73,168 | 0.03% |
| First US Bank | AL | State | 13 | 779,593 | 2 | 65,809 | 0.03% |
| Highland Federal Savings and Loan Association | TN | Federal | 0 | 0 | 2 | 60,422 | 0.03% |
| Evolve Bank & Trust | AR | State | 4 | 1,063,810 | 1 | 59,876 | 0.03% |
| FSNB, National Association | OK | Federal | 47 | 339,162 | 36 | 58,413 | 0.03% |
| Lawrenceburg Federal Bank | TN | State | 0 | 0 | 1 | 58,223 | 0.03% |
| The Lauderdale County Bank | TN | State | 0 | 0 | 2 | 56,431 | 0.03% |
| Gates Banking and Trust Company | TN | State | 0 | 0 | 1 | 55,356 | 0.02% |
| PNC Bank, National Association | DE | Federal | 2,612 | 446,626,135 | 3 | 54,912 | 0.02% |
| Brighton Bank | TN | State | 0 | 0 | 1 | 50,232 | 0.02% |
| Community First Bank, Inc. | SC | State | 10 | 549,789 | 2 | 44,695 | 0.02% |
| Oakworth Capital Bank | AL | State | 2 | 991,428 | 1 | 39,345 | 0.02% |
| Farmers Bank | TN | State | 0 | 0 | 1 | 37,923 | 0.02% |
| First Jackson Bank, Inc. | AL | State | 5 | 299,778 | 1 | 35,465 | 0.02% |
| Powell Valley National Bank | VA | Federal | 6 | 357,299 | 1 | 32,620 | 0.01% |
| New Peoples Bank, Inc. | VA | State | 20 | 678,040 | 1 | 30,267 | 0.01% |
| First Commercial Bank | MS | State | 4 | 614,794 | 1 | 29,057 | 0.01% |
| The Citizens Bank | KY | State | 2 | 137,445 | 1 | 28,729 | 0.01% |
| Trupoint Bank | VA | State | 11 | 466,853 | 1 | 22,361 | 0.01% |
| First State Bank of The Southeast, Inc | KY | State | 8 | 298,217 | 1 | 20,245 | 0.01% |
| Community Bank of Mississippi | MS | State | 49 | 4,280,125 | 2 | 14,975 | 0.01% |
| The Bank of Marion | VA | State | 15 | 472,132 | 1 | 12,518 | 0.01% |
| First National Bank of Eastern Arkansas | AR | Federal | 13 | 495,459 | 2 | 9,594 | 0.00% |
| Number of Institutions in the Market: 170 | Totals | 25,396 | 7,527,962,198 | 1,932 | 222,157,315 | 100 |
Deposit market in Tennessee. Source: FDIC, deposit market share report.
Appendix C: Community Banks by State
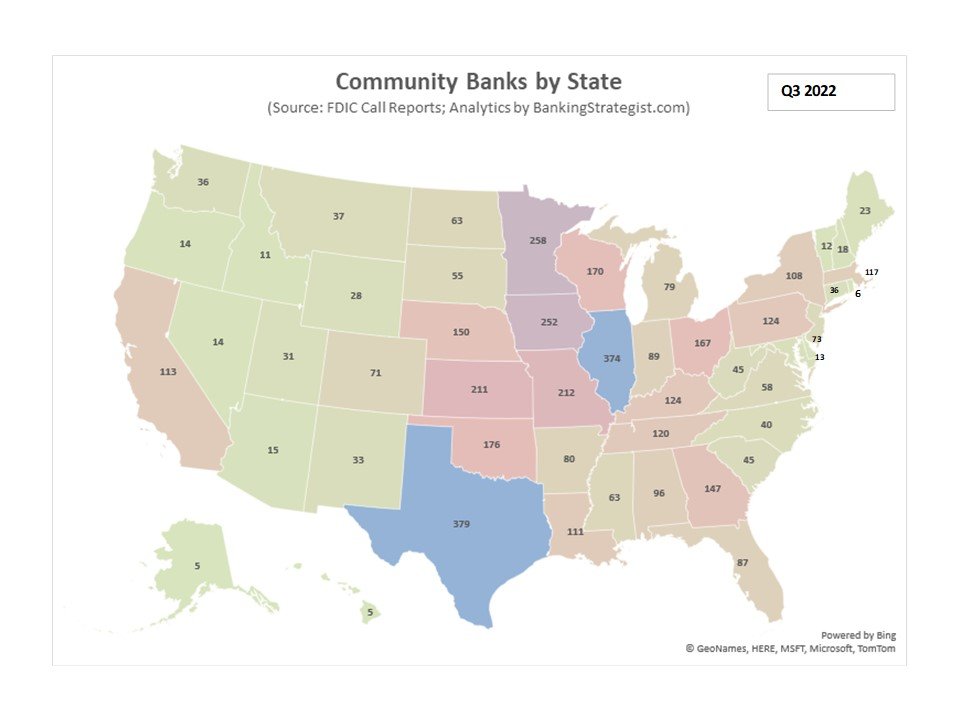
Number of community banks by U.S. state as of Q3 2022. Source: Banking Strategist.
Footnotes
1. Enterprises mostly start as micro or small enterprises, but might grow to become large enterprises. Few start-ups (2%–9%) grow above ten employees, but they make a substantial contribution to job creation, ranging from 19% to 54%. It is ultimately only a few enterprises that grow to become larger enterprises and generate most of the new jobs. These high-growth enterprises are often referred to as transformational entrepreneurs, graduate enterprises, or gazelles, and they create vibrant businesses with jobs and income for others, beyond the scope of an individual’s subsistence needs. In contrast, subsistence entrepreneurs usually do not grow, but provide income and employment for the owner of the micro-enterprise and his or her family (International Labour Office, 2015, p. 10).
2. Net job creation 2004–2010 by age group of enterprises that survived. Source: De Kok et al. (2011, p. 8). Based on Amadeus/Orbis, Bureau Van Dijk.
3. In the EU, companies wishing to raise capital in public markets through the issuance of shares or bonds have a choice between two broad categories of venues: regulated markets and multilateral trading facilities. Even though both categories are open to companies of all types and sizes, regulated markets have compliance requirements that render listing costlier and cumbersome for smaller firms (European Parliament, 2019, p. 2).
4. The collateral typically consists of business assets or equipment, real estate (both commercial and personal), accounts receivable and inventory, liquid assets from the company or a guarantor, and personal assets (FDIC, 2018, p. 42).
5. In the OECD countries, in 2008, the median interest rate charged to SMEs was 15.5% higher than the rate charged to large enterprises, whereas in 2016, that percentage had more than doubled, standing at 32.7% (OECD, 2018, p. ).
6. In 2009, for instance, only 5.2% of loan applications were rejected among large firms, that share was double for small firms and even three times as large among micro businesses (European Commission, 2009).
7. The term “community bank” is used generally to describe locally-owned, medium and small depository institutions that engage in highly localized traditional banking activities. There is no universal definition of a community bank, although most definitions rely upon an asset threshold set at $10B or less (see Council of Economic Advisers, 2016). Community banks should not be confused with credit unions. A credit union is a membership-owned cooperative organization established on the basis of its common bond (occupation, association, or geographical definition), specified by its federal or state charter. Credit unions face statutory restrictions on their customer base and commercial lending activities because, as specified in the Federal Credit Union Act of 1934 (FCU Act; 48 Stat.1216), they are formed for the purpose of promoting thrift among their members and providing them with a low-cost source of credit. Unlike community banks, credit unions have a statutory cap on their business lending activities. Conversely, a bank is a for-profit institution owned by equity holders who may not necessarily be customers (depositors or borrowers). Although it must also obtain a state or federal charter, a bank does not have similar membership and commercial lending restrictions. Community banks issue deposits, insured by the FDIC; credit unions issue “share deposits,” insured by the NCUA (CRS, 2018).
8. See https://foe.scot/wp-content/uploads/2012/05/Edinburgh-Werner-Case-for-Local-Banks-2012.pdf
9. These authors find a negative correlation between the percent of deposits in banks with less than $500 million in total deposits and population density by state in the U.S.
10. Real estate loans constituted around 20% of the balance sheet of both small and large banks in 1985. However, they started to diverge, and while for large banks the share rose to a peak of 30% in 2008, for small banks the peak reached 50% that same year. See Board of Governors of the Federal Reserve, H.8 Assets and Liabilities of Commercial Banks in the United States.
11. Net exports were -3% in 1986 when the decline in the number of banks began. See https://fred.stlouisfed.org/series/A019RE1Q156NBEA
12. Banking systems are typically structured in a hierarchical fashion (in “tiers”), with central banks at the top, large “money center” banks in the middle, and smaller banks at the bottom. Typically, central banks (first tier) act as bankers for big banks, which in turn act as (correspondent) banks for smaller (respondent) banks. Big banks use reserves (the central bank’s liability) to settle interbank payments, while smaller banks use nostro accounts at correspondent banks to make payments to each other. At the bottom stand the rest of economic sectors, like households, non-financial firms, non-bank financial institutions, and the government (This is a simplification. Typically, access to reserves is not restricted to large banks, and the government as well as large non-bank financial institutions have access to the books of the central bank. Similarly, firms and households tend to have accounts both at large correspondent banks as well as at small respondent banks.) Typically, the relationships extend to credit as well, so that only large banks are eligible counterparties for central bank open market and credit operations.
13. See, e.g., Borsuk et al. (2022) and Panizza (2022).
14. The bank was initially prohibited from opening branches, engaging in retail banking, and providing commercial lending other than farm real estate loans. Although these restrictions were relaxed in later years, to this day BND operates out of a single location in Bismarck, which limits the degree to which it can compete for customers (Kodrzycki and Elmatad, 2011).
16. The number of loans distributed by BND in 2021 was 557 loans (BND, 2021).
17. Although the average share of profits that BND transfers to the state is large, the overall share of state expenditures financed by this means is fairly small. From 1971 to 2009, transfers from BND were equivalent to 0.75% of state expenditures, on average. The highest share (1.82%) occurred in 1996 (Kodrzycki and Elmatad, 2011).
18. Number of banks per 100,000 people, 2014. Source: ILSR.
19. Tennessee had a population of 7,051,000, and 220 banks. See https://www.census.gov/quickfacts/TN and Banking Strategist.
20. As of 2021, the U.S. had 4,236 FDIC-insured commercial banks, and a population of 332,660,077 as of December 2021. See https://www.statista.com/statistics/184536/number-of-fdic-insured-us-commercial-bank-institutions/), and https://www.census.gov/popclock/).
21. During the financial crisis of 2007–2008, for example, BND used its access to the federal funds market to purchase loans from smaller banks in North Dakota, providing liquidity to the market. In the wake of natural disasters such as flooding or drought, the bank has channeled its resources to affected areas. During disasters, BND is said to react more quickly than the federal government (Kodrzycki and Elmatad, 2011).
22. The QTDC was tested in Japan by Werner (1992, 1993, 1994, 1997), it was later applied to the Czech Republic (Bezemer and Werner, 2009), the UK (Lyonnet and Werner, 2012; Ryan-Collins, Werner and Castle, 2016), Spain (Werner, 2014c; Bermejo-Carbonell and Werner, 2018), Germany (Kusin and Schobert, 2014), and Japan later again (Werner, 2005, 2012; Voutsinas and Werner, 2011b).
23. It is quite well-established that house prices can be explained by: (i) on the demand side, the amount of real estate loans and household mortgages (Anundsen and Jansen, 2013, p. 6, Tables 1 and 2; Werner, 1997), and (ii) on the supply side, the elasticity of supply of housing by the construction sector (ESRB, 2015, pp. 31–32; Gao et al., 2015, p. 1; Gyourko, 2009, p. 11), which in turn is influenced, among other things, by regulatory supply constraints, city-level population, population density, and geographic constraints like steep topography (Glaeser et al., 2008, pp. 36–37; Oikarinen and Valtonen, 2014).
24. In a world with high debt-to-GDP ratios, this is most welcomed.
25. Source: FDIC, Deposit Market Share Report.
26. In contrast, the BND was set up with an initial capital of $2 million in 1919 dollars, which corresponds to $25 million in today’s dollars (inflation-adjusted) (Kodrzycki and Elmatad, 2011).
28. Assuming a 50/50 split, around $5 billion of deposits would come from community banks transferring their deposit balances from other banks, and $5 billion from TSG. For community banks, this would represent shifting around 15.2% ($5/$32.7) of their assets to SBT, which is a reasonable figure.
© Copyright 2023 Richard Werner All Rights Reserved. The preparation of this Report was sponsored by the Solari Report.